Comprehensive product thinking to make machine learning accessible to non-data-scientists.
Self-service predictive analytics for line-of-business users multiplies the usefulness of data science work in an organization.
What Is a Touchpoint?
The Touchpoints application was designed to further the democratization of data science by solving a problem in the data science process and deliver data-driven results to as many people as possible.
A Problem With the Data Science Business Process
As machine learning becomes an integral part of Business, the demand for predictive insights increases swiftly. Line-of-business users have scenario questions and want the results in order to make the best possible decisions.
Typically, in an organization, the process of getting data-driven insights follows a five step process:
- The business group has a question (a scenario) and requests an analysis.
- The analytics team prepares the data.
- The data scientist explores the data, develops a model, and provides answers to the question.
- The team reviews the results.
- The business group uses the answers to make decisions.
Changes in the business scenario because the questions have evolved or the data has changed require a new request, and the cycle must repeat. Which means that the business team has to wait for results.
Solution
Touchpoints solve this problem by packaging analytics into a convenient "app" for the business user, giving them self-service access to analytics results without having to learn data science.
Key Points:
- Self-service analytics for front-line business users.
- “App Store,” a searchable gallery of previously-built Touchpoints.
- Simple form-based interface for the end-user. No coding required.
- Easy to try different scenarios, toggle outputs, and review results over time.
- Collaboration is an innate part of the system.
About the Project
Project Roles
As Product Design Director, I took the original idea (developed through internal discussions) and from that starting point:
- Created the product definition
- Set the product scope and requirements
- Designed the Touchpoints user experience from end-to-end
As the project progressed, I iterated the product design based on feedback from customer presentations and developer collaboration. I also contributed hands-on development for release completion and user experience polish.
Design Process
To get from initial idea to implementation with Touchpoints, I used a methodology of divergent and convergent thinking, adapted in this instance to the conditions of a small team and a short release cycle.

Divergent
The divergent phase is about creating choices.
Creating choices involves stepping away from given presumptions about what the solution should be, and understanding what the context is, what the problems are, and what issues exist. Assumptions are challenged. Perspective is established. In order to do this, it is critical to get wide exposure to a diverse variety of influences and inspirations, including competitive analysis, comparative cases, analogous patterns in other seemingly unrelated applications, research, historical precedent, and future possibilities.
Out of divergent thinking comes a robust definition of the actual problem (or problems) and what needs to be created.
Convergent
The convergent phase is about making choices.
During this period, the design work synthesizes and narrows down to a solution that solves the right problems. Most of the familiar design artifacts are convergent, each interrelated but built on the foundation of the work that preceded, each honing in on the final product.
Cycles in Cycles
Viewed from afar, the overall process is a single inexorable large movement from left to right, divergent to convergent. In detail, though, there are many small cycles inside of the large, making the actual process fractal-like in its nature.
Product Definition
Delivering on the Product Strategy
The preliminary definition effort first established how the new application would connect to the strategic product themes (see: Alpine Chorus Strategic Design) and the business goals built into those themes:
- Broaden the audience
- Provide more value
- Enable the social enterprise
Product Goals
Next, success goals specific to Touchpoints were articulated to orient the product and help refine the conceptual design work:
- Increase data model lifecycle coverage provided by Alpine Chorus
- Contribute to making Alpine Chorus an indispensable part of how business works
- Expand the range-of-value for data science work in the organization
“Range-of-Value”
Range-of-value is a term I coined to quantify and explain the scope, or radial range, of people in the company that can directly utilize machine learning analytics. Historically, that range is limited to the data scientists, who are the only ones in an organization with the access, skills, and tools to build models and conduct analysis.
Touchpoints expand that range by orders of magnitude to reach the business users, who now have nothing separating them from the analytic results they want.
In terms of application users, the number of data scientists in an organization is typically in the single digits. Workspace project team members number in the 10’s. The business users number in the 100’s. The user base is multiplied dramatically.

From stategic design work.
Cast of Characters
The primary user personas defined the sphere of users for Touchpoints.
- Data Scientist
“The Modeler” - Creates analytic workflows.
- Workspace member.
- Business/Data Analyst
“The Builder” - A bridge between the data and the business.
- Takes the analytic workflow created by the Data Scientist, develops the Touchpoint, and publishes it out to the wider organization.
- Workspace member.
- Business User
“The Data Science Consumer” - New user role in the platform.
- Uses the Touchpoint results to make business decisions.
- Organization member, but not a workspace member.
UX Goals
Finally, specific user experience goals asserted how the tool should present to the user:
- Easy to understand
- Easy to create
- Easy to find
- Easy to use and get results
- Easy to collaborate
Central Product Concept: the Workbench
You Complete Me
Initial designs conceived the Touchpoint as a regular document in a workspace, and it behaves like all the other regular documents in Chorus. By doing this, a Touchpoint document automatically acquires the features of all workspace files: access is limited to workspace members, documents are versioned, social commenting is available, and the document can be shared with other team members.
However, the limitations of this became evident when working out the overall interaction design, including:
- Regular documents required workspace membership for access. But business users were not workspace members. Changing this would require changing the entire licensing model.
- Chorus inherently limited what could be done with a document type on its landing page, which is where editing would happen.
Existing behaviors in Chorus were insufficient for what was a completely new feature in the system. This forced me to reimagine how the user should create, edit, and use a Touchpoint. Returning to the ideas from the divergent phase, the way forward came by breaking away from the “regular” model and designing a new model.
The answer is the workbench.
The Workbench
Tailored to the dual tasks of composing and using Touchpoints, the workbench took the existing application language and extended it to create what is effectively an integrated development environment for the analytics apps.
The workbench has two modes: one for editing (create new is a special case of editing), and one for running (details of both below, in the lifecycle section).
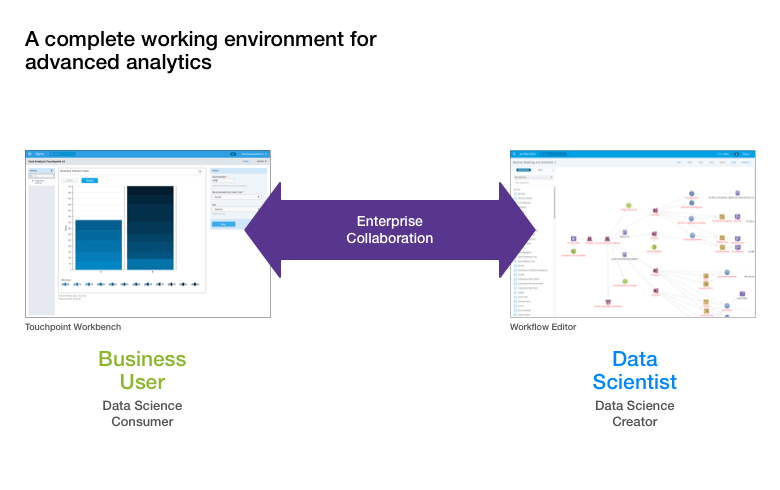
Creating a Complete Environment
Viewed holistically and strategically, the workbench neatly complements the workflow editor and closes the loop on data science collaboration.
The data scientist has the workflow editor. The project team has the workspace. As the business user becomes engaged in the platform, the workbench makes a more comprehensive environment as a tool made for business users and the non-data scientist user.
The Touchpoint Life Cycle
The lifecycle of a Touchpoint was designed to go from inception to decision.
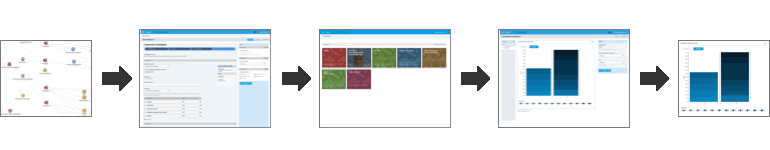
- Develop the workflow
- From the initial request, create the model.
- Create the Touchpoint
- Using the model, connect the workflow variables to user inputs.
- Publish the Touchpoint
- Make the finished app available to everybody.
- Run the Touchpoint
- Launch the app, enter values, and run it.
- Use the results
- Share. Download. Make decisions.
Workflow & Workflow Variables
A Touchpoint begins with a workflow in a workspace.
The data scientist develops the analytical model that will be the “engine” of the Touchpoint using the Alpine workflow editor. During development, variables are used for model parameters that need to accept user input. Workflow parameter variables, which were already a latent feature in the system, are just like regular programming variables; each has a unique name and initial value, and they are used in place of a static number or value.
When the model is finalized, the data scientist passes the workflow to the data analyst for the next step.
Create/Edit
Workbench: Compose Mode
Creation is done within the new workbench environment using the “compose” mode; create new is handled as a special case of editing. The process is structured as a wizard-like sequence of steps: first, the workflow is designated, then details (name and description), followed by run-time and output settings, and concluding with the input parameter builder.
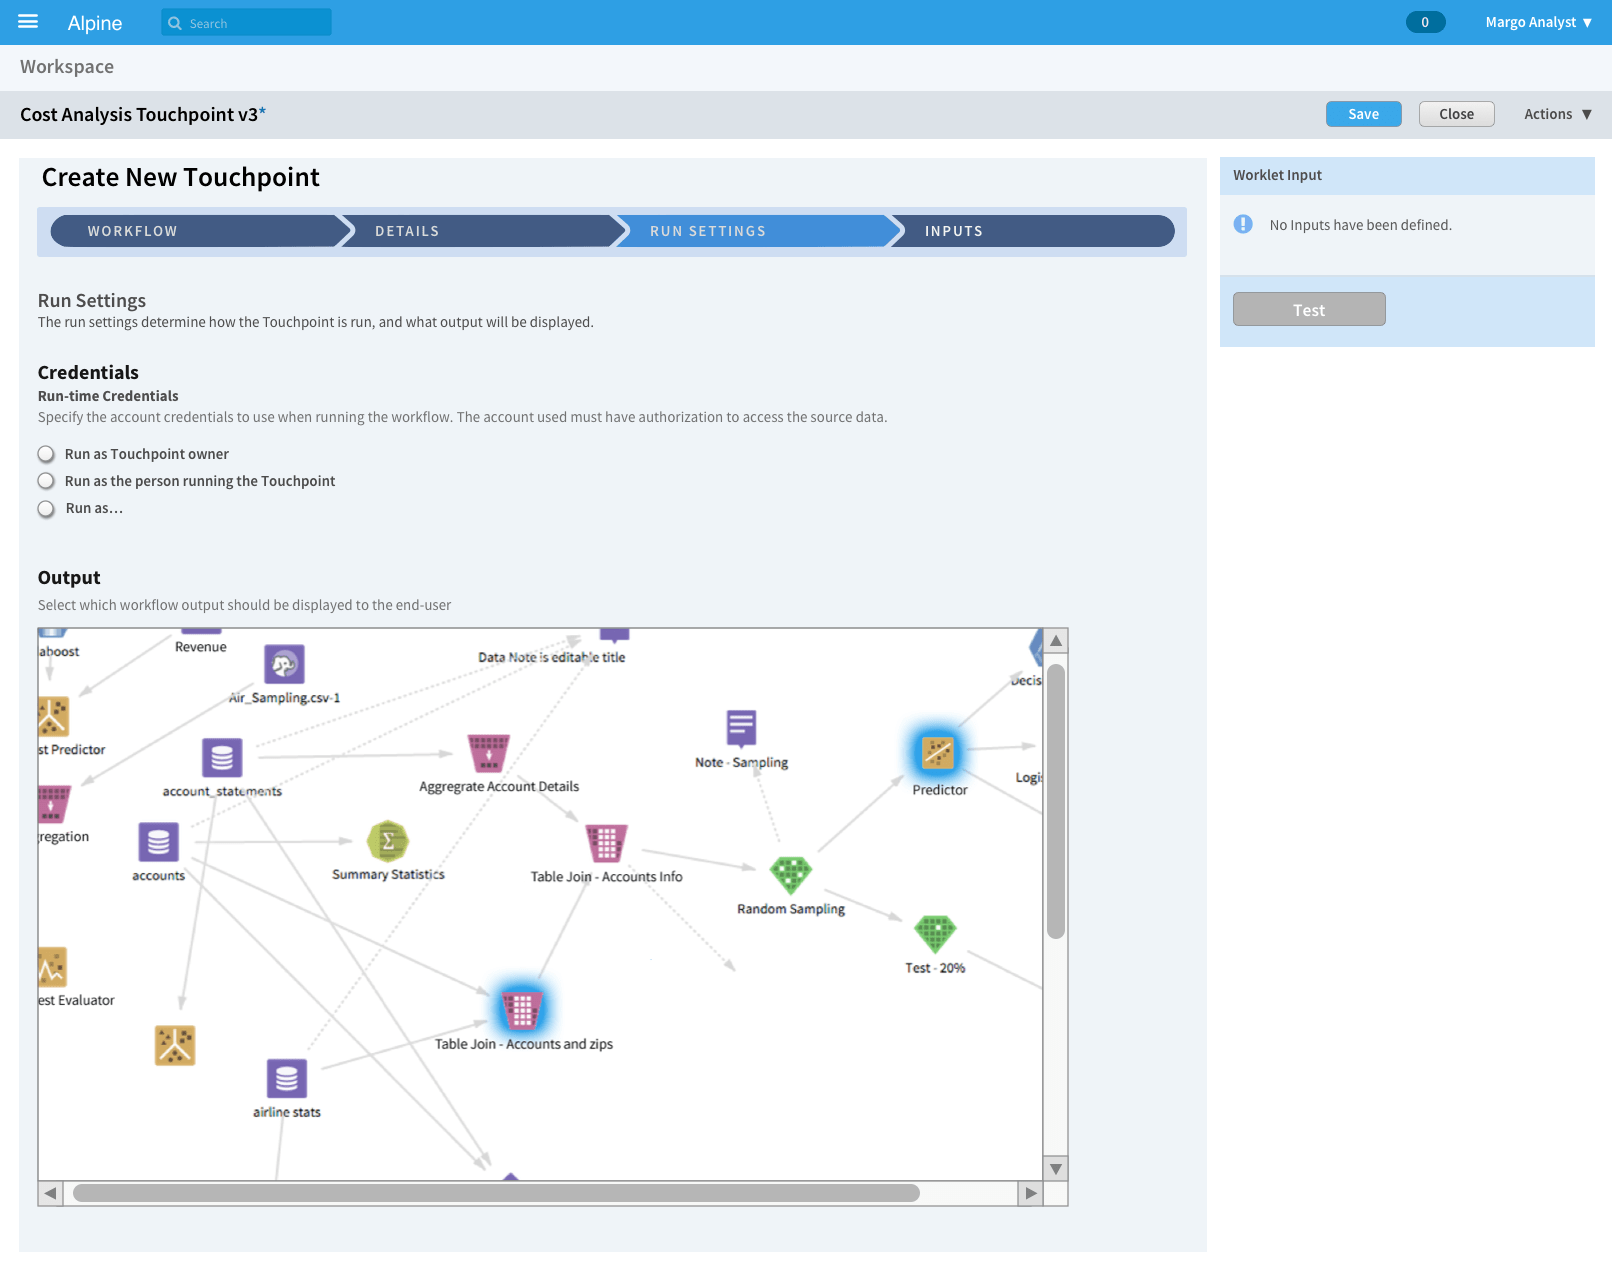
Output Selection
In simple terms, a workflow is a sequence of operations that starts with data, conducts transformations and machine learning operations on the data, and outputs results.
A typical workflow can have many paths and endpoints — some are for data exploration, some are experiments that might have been early ideas, and only a few are relevant to the business application. A method was needed to control the output, limiting it to enable the desired outputs and to turn-off unwanted or irrelevant output results that do not need to be exposed to the end-user.
Through iteration, a design for this problem was found that is a natural and consistent behavior in the environment. Using the visual workflow itself, the data analyst simply selects the operators whose output should be displayed when the Touchpoint is run.
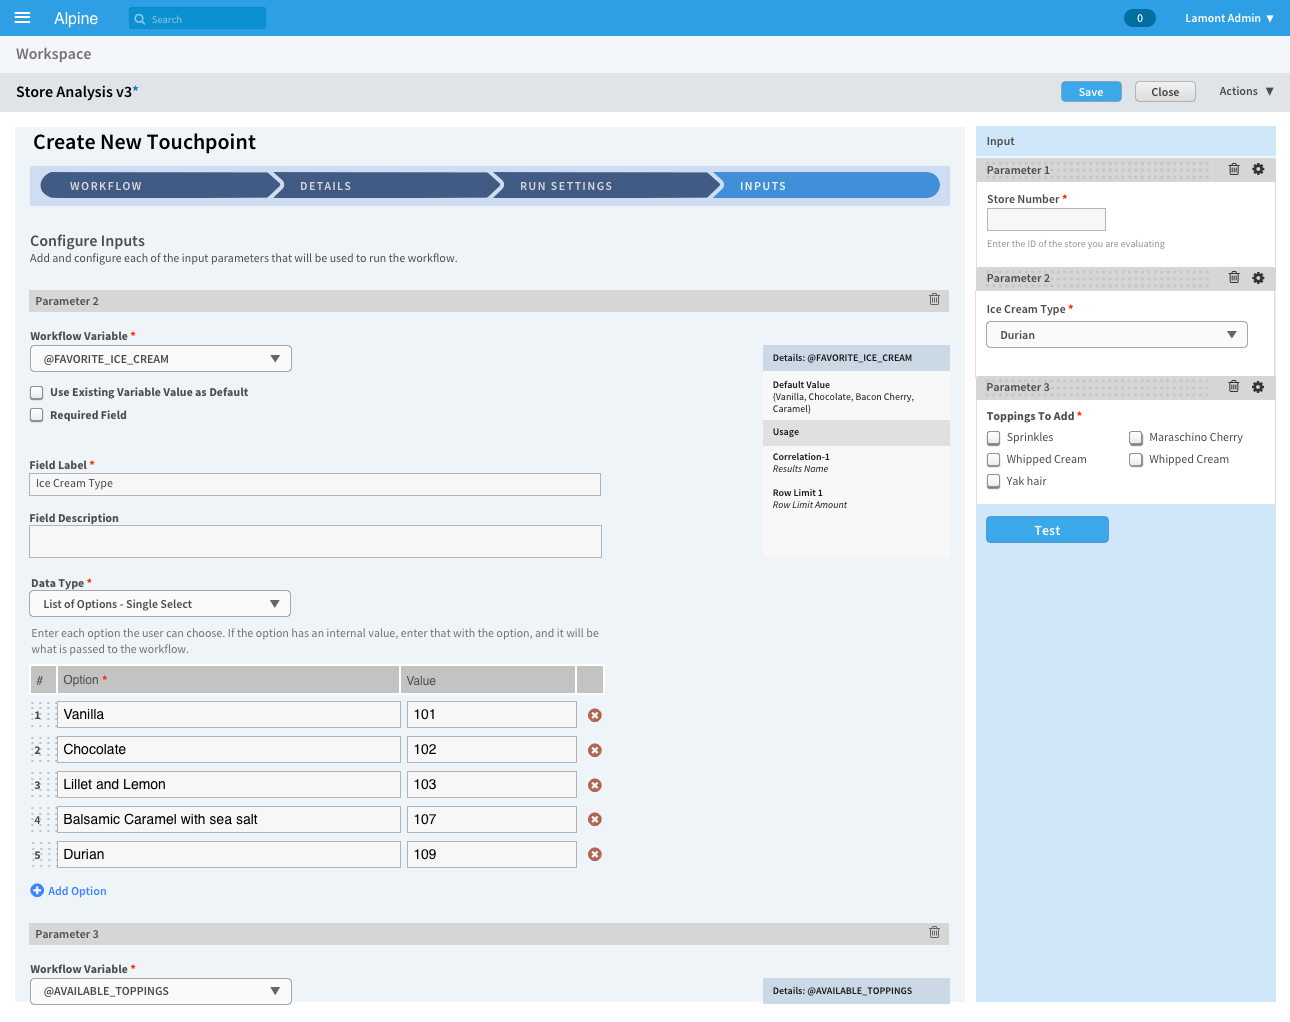
Input Builder
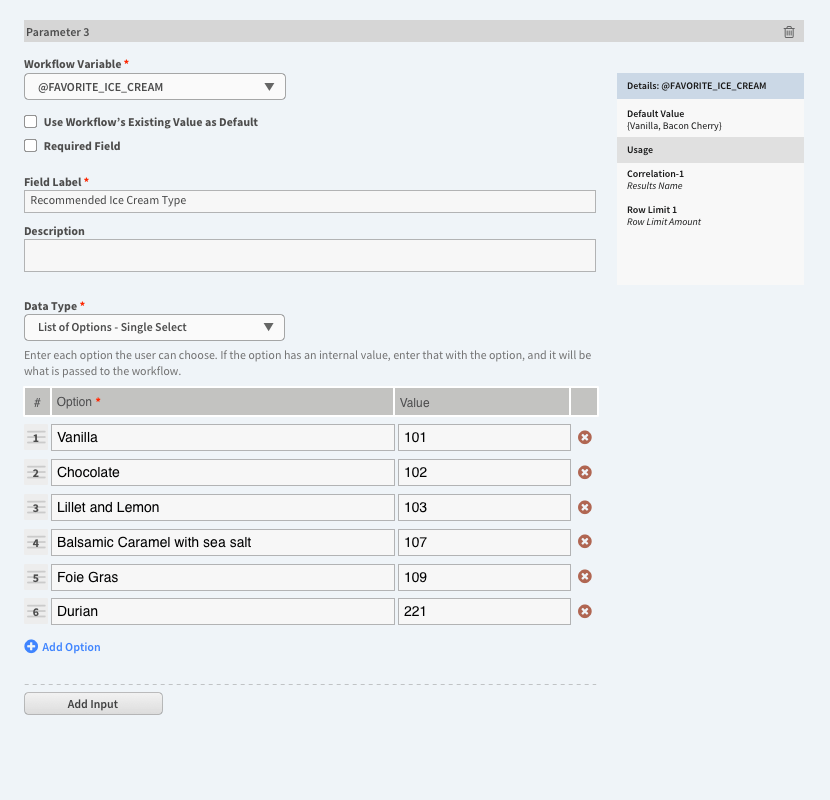
The most important part of creating a Touchpoint is assembling the inputs (the fourth step). The model I chose for this is a web form constructor, adapted to the situation.
The purpose of the parameter builder is to create the connections between the input needed for the workflow to run and the scenario values entered by the person running the Touchpoint. This is done in the main column (left side) by selecting an available workflow variable, giving it a real-world label, and defining the data format that the input can accept. The data analyst (i.e. the person creating the Touchpoint) adds as many inputs as necessary (up to the number of available workflow variables), one after another. The right column displays a (nearly) WYSIWYG version of the fields as they will appear when running the Touchpoint; when an input is changed, the right-side updates dynamically so that the display shows the real-time state.
Data Translated to Business
Each value is mapped to a user-friendly name, shielding the Touchpoint users from the technical format of the workflow variables and values, which improves usability and engagement.
The workflow variables are technical in nature, and I felt that they were not appropriate to expose to the audience in their normal state. Their values also have this problem. This is solved by the ability to create end-user friendly labels for the variable data and mapping them together. By doing this, the data value, which is machine-friendly, becomes human-friendly and meaningful to regular users.
This design is philosophically biased to require more work upfront during the creation process so that it is easier for the business user.
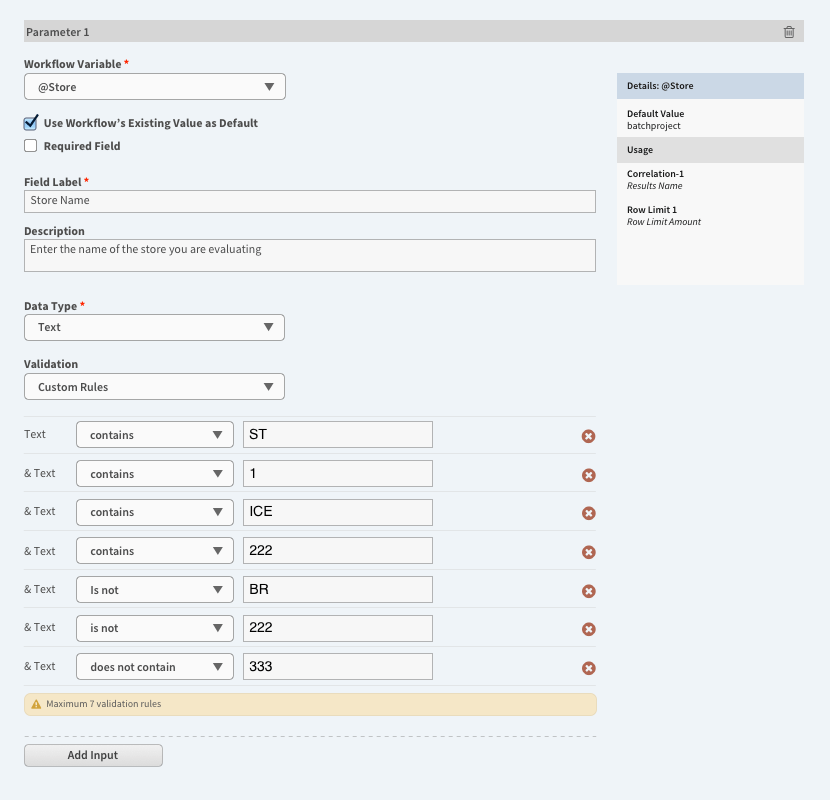
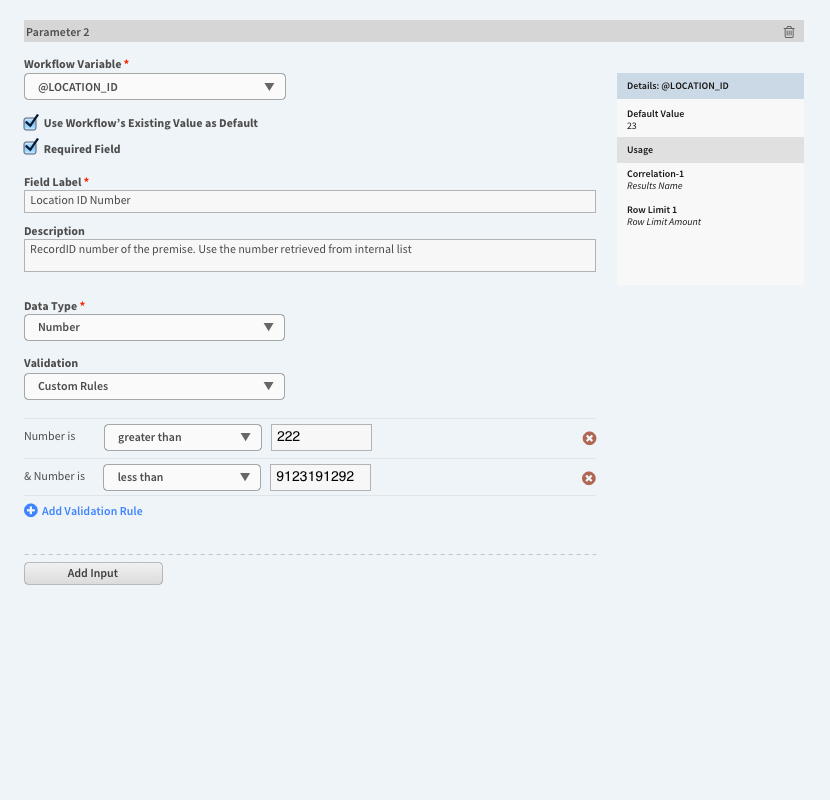
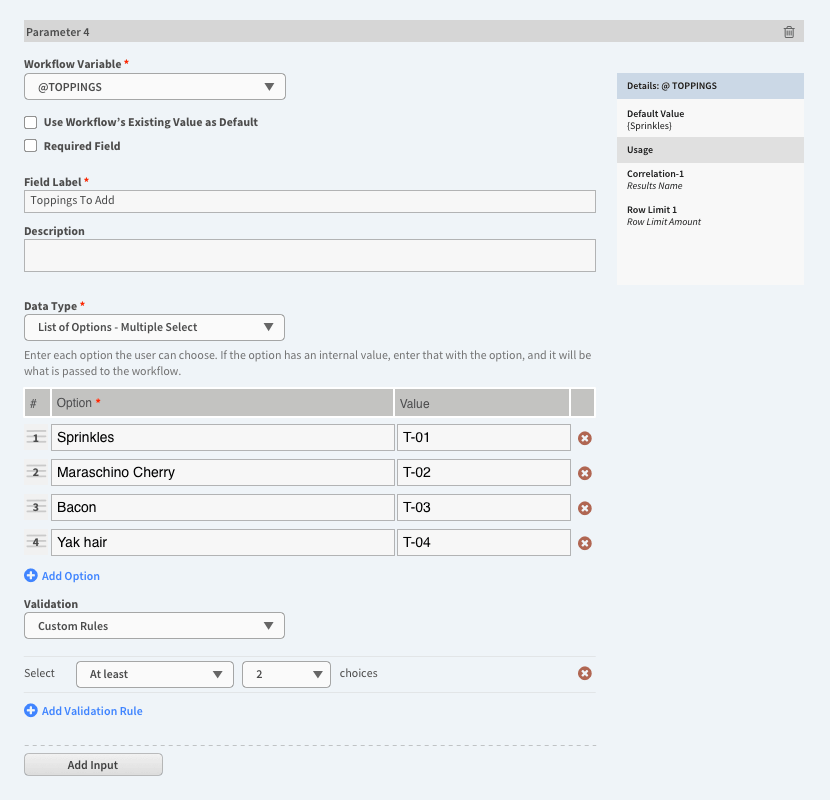
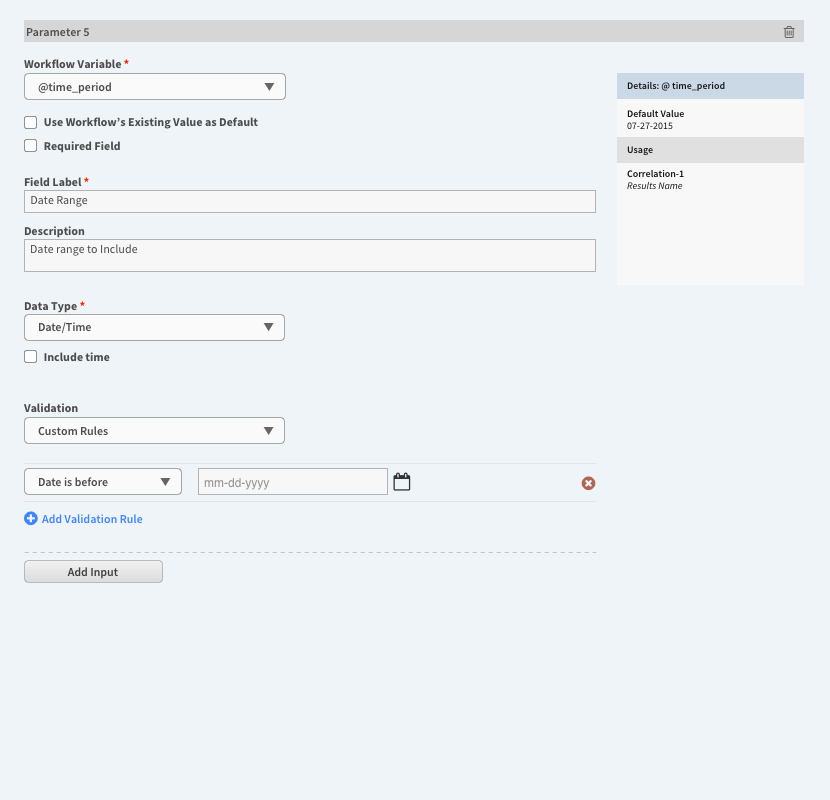
Input Types
The first release of the workbench featured five data input formats, chosen to cover the most common structured input needs (more advanced formats would be added in future releases).
- Text
- Numbers
- List, single selection
- List, multiple selection
- Date/time
Each type has been designed to automatically provide basic (format-appropriate) input validation and has the option for custom business validation. For example, numbers require numerical input and will not allow letters (basic validation), and can be constrained to a particular range (custom validation). The ultimate form (i.e. when the Touchpoint is being run) displays the appropriate browser-native form fields to the end-user along with appropriate cues (e.g. supporting placeholder cue text).
- 1
- 2
- 3
- 4
- 5
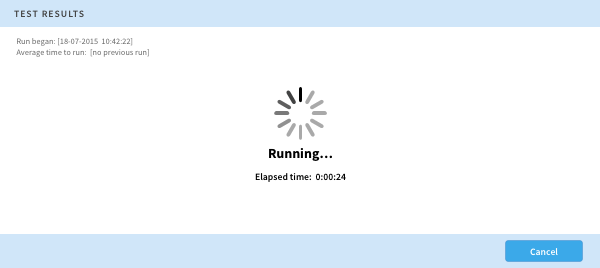
Test/Preview
The capability to test/preview was provided as a necessary part of the development process so that the data analyst can be confident that everything is working correctly before making the Touchpoint available to other people.
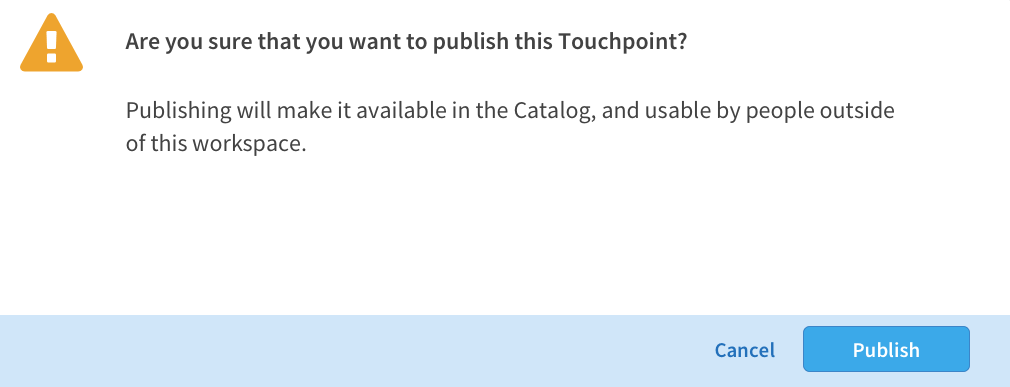
Publish
A Touchpoint, created and managed within a workspace, can be kept within the workspace confines, where just the workspace members can access it. This might be the right option in some cases.
But this can be limiting, since only the workspace members can access it. The goal of the product design was to invent a solution that will be used by orders of magnitude more people than just the initial project team. Publishing the Touchpoint is the designed way to achieve this.
Publish is an action for Touchpoints that distributes it to the entire organization by making it available outside of the workspace in the new site-wide catalog.
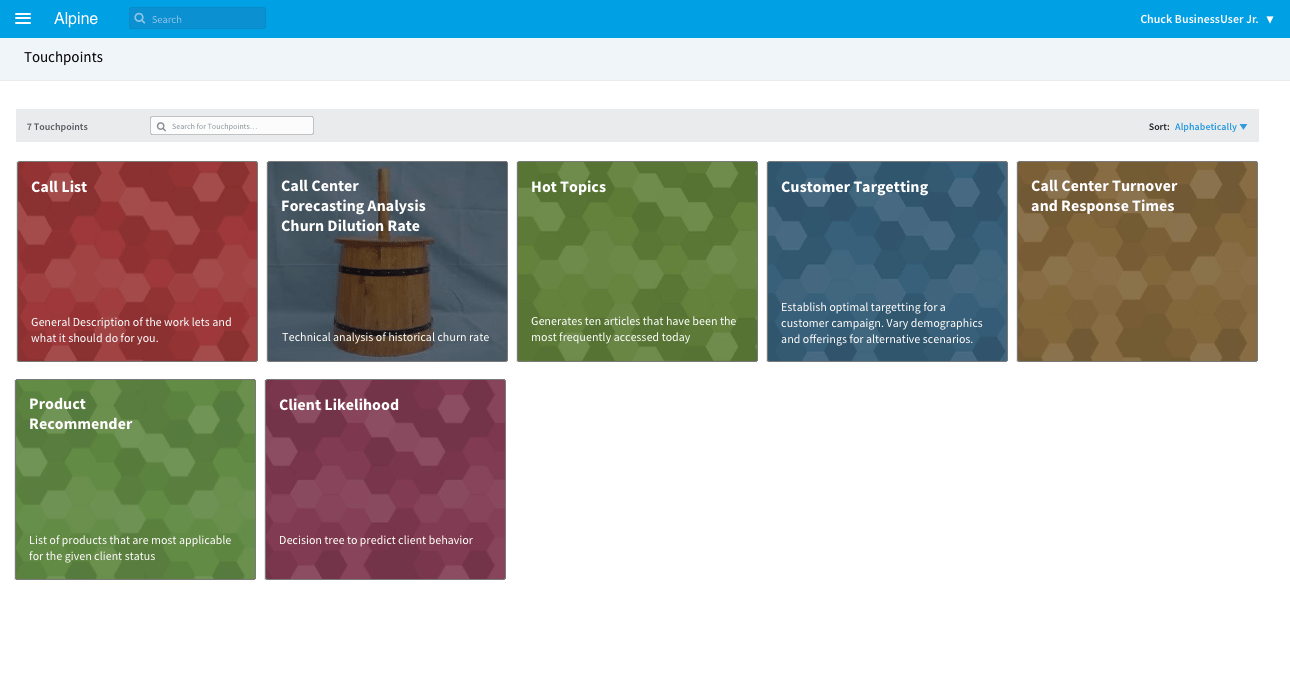
The App Catalog
The app catalog is the “store” where apps are accessed and launched.
Available from the new top-level location in the primary navigation, the catalog presents a browsable collection of all the published Touchpoints. It was designed to be familiar and accessible, with a user-friendly card-like grid layout that is unlike anything else in Chorus. In addition to displaying the name and description, each one has an approachable visual identity: either a generated default image or a custom image that can be uploaded when creating/editing the Touchpoint.
To launch one, select it, and the run environment opens.
Findability
Findability within the catalog is provided by filtering/search and sorting options.
Furthermore, a user could search for a Touchpoint at any time. The design choice to make a Touchpoint an entity within a workspace meant that it will be indexed by the application’s search engine, and that in turn allowed anyone to search for a Touchpoint in the same manner that they search for anything else in the application: using the ubiquitous search field in the header bar.
Catalog Roadmap
The initial launch of the catalog was austere, consisting of a single top-level view into the available apps.
The next iteration of the catalog had a clear design direction (derived from the dashboard) where the default view of the catalog was a personalized set of Touchpoints. With any Touchpoint, a user would be able to save that particular app, which would add it to their own collection. In this manner, they would build their own personal catalog that is relevant to themselves and their current business issues.
This is equivalent to the familiar app-store pattern where a user has a list of apps they have installed and can browse the full store to select others.
Because an empty page would be a wasted opportunity, heuristics were devised to display apps on a new user’s page (before they have done any customization), based on parameters specific to the user, their role, and activity metrics (e.g. most active, most used, etc.).
Running the Touchpoint
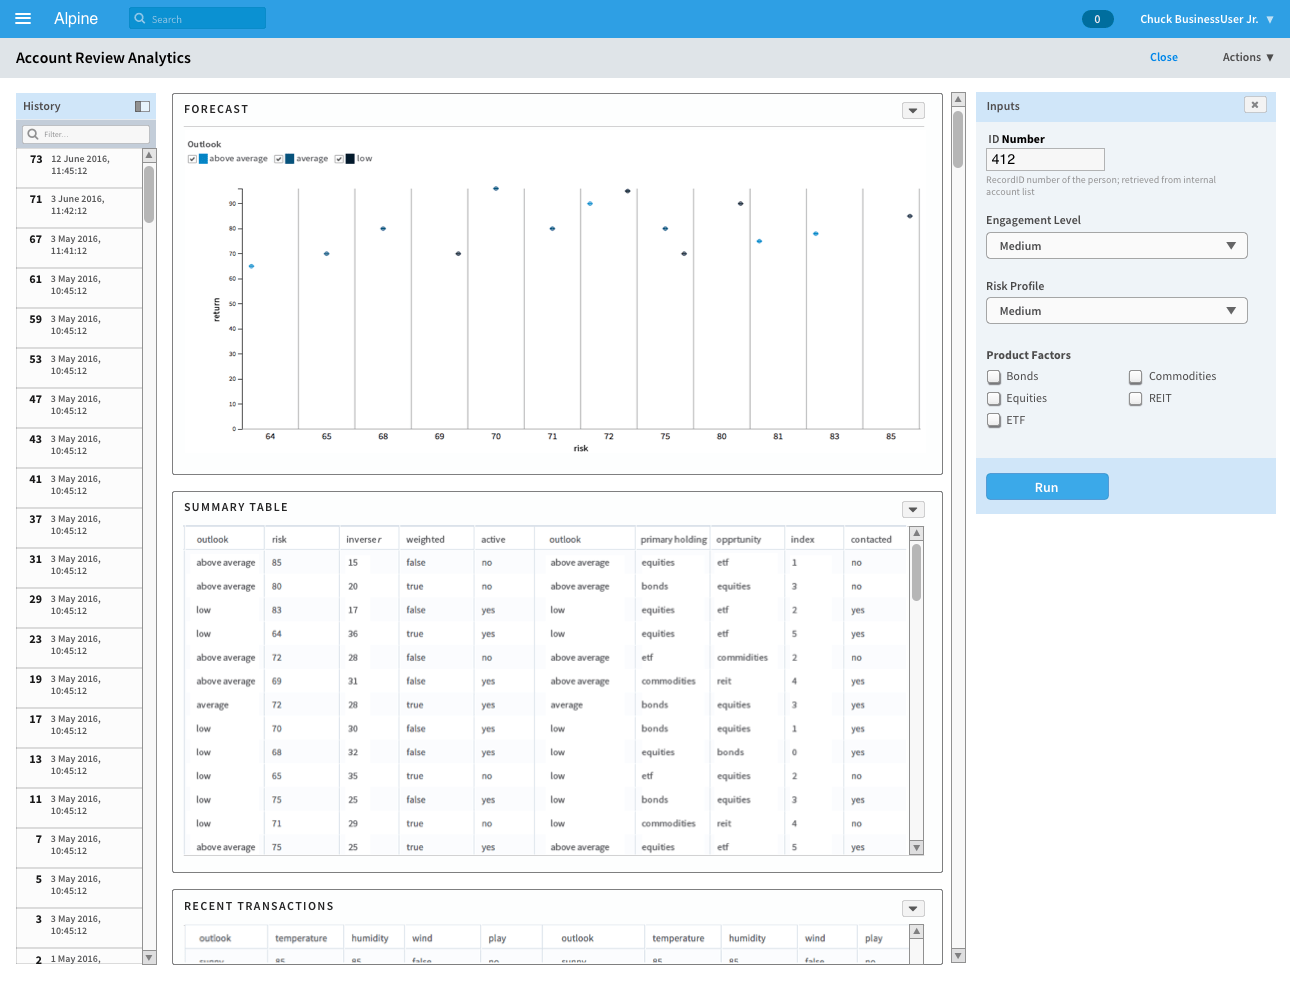
Using a Touchpoint takes place in the workbench’s run mode.
The counterpart to the compose mode, the run interface is structured to be user-friendly with an emphasis on results:
- The primary center column displays the output (or a guidance message for the empty state).
- On the right side are the fields to input the scenario values and start execution.
- On the left is a list of historical runs.
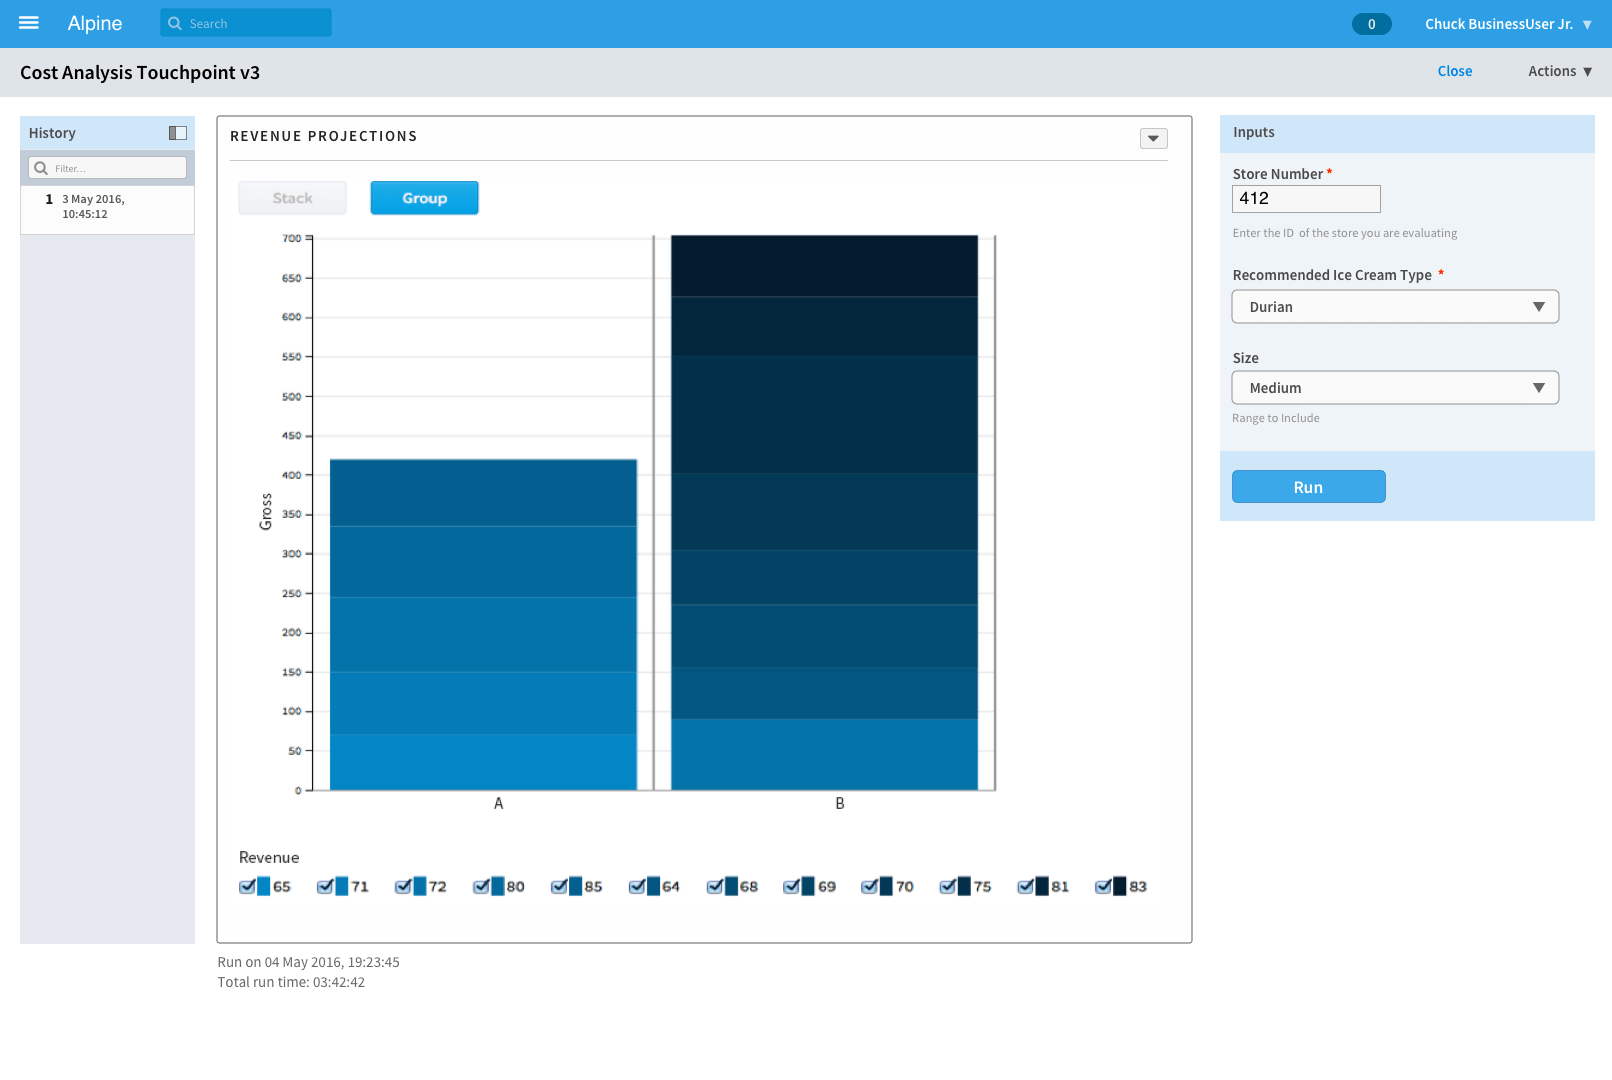
The work done by the data analyst to build and configure the parameter inputs is realized in the simplicity of the interface for running the Touchpoint. Standard form elements display the inputs and the end-user-facing labels defined for them. Here, the business user enters the values for their business scenario (i.e. their current question) and submits them.
Long Running Questions
Some scenarios may take a long time to evaluate; the workbench has been designed to address this. The user can navigate elsewhere in Chorus and work on something else, even a different Touchpoint. When the process is finished, a notification will be delivered to the user (via the existing in-app notification system), linking them directly back to the Touchpoint, where the run event will be the most recent entry in the run log.
Historical Run Log
Each time the Touchpoint is run, the parameters and results are stored, and the event is recorded in the run log, encapsulating that scenario for the user.
The log was designed to be personal and persistent, scoped to the individual over the lifetime of the Touchpoint — each user has their own log for each Touchpoint that they use, and that log will display whenever they open the Touchpoint. This was a product behavior made to prioritize ease of use and automatic behavior that lets the user devote their attention to getting the results they need, versus having to expend attention on saving the results themselves. Of course, each person also has control over managing the list (i.e. culling entries).
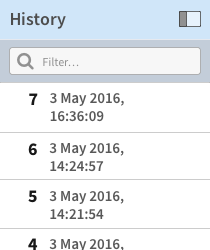
Business users often need to take an earlier scenario, change it slightly to reflect new conditions, and run it again with the new values. The history list makes it easy to reload a previous scenario and use it as a starting point. Select one of the historical entries, and those results will be shown, while the input fields are populated with the values used for that run. The user can adjust the values as needed and submit it again to make a new run.
Designed as a flat chronological series for the first release, the history log has the capacity to grow to support more sophisticated relationships with multi-level connections and path dependencies. This defines a trajectory forward that supports a natural way of working.
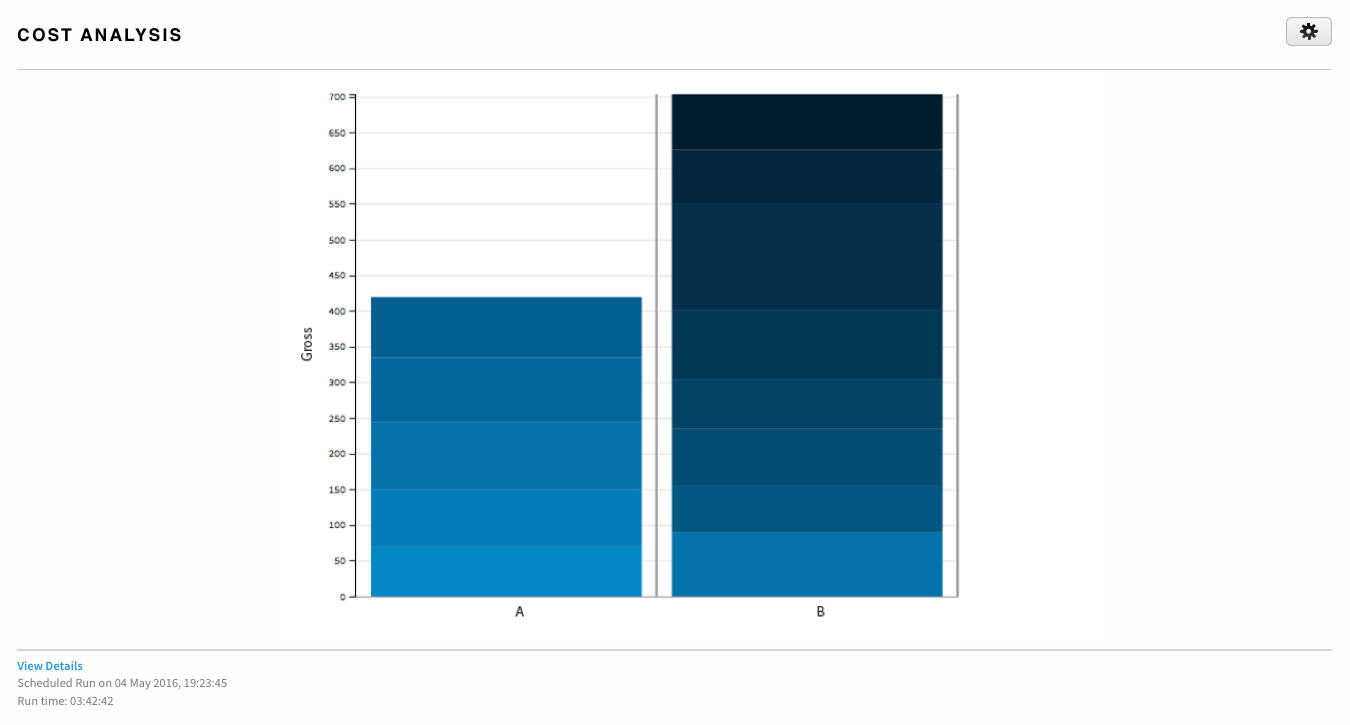
Business Results
With the run results, the cycle comes full circle back to collaboration and the social enterprise.
Touchpoint output has been constructed to enable the user to get what they need to employ the analytics in their own personal decision-making process. Adopting a structured modular layout (once again leveraging the product design language established in the Dashboard Framework project) is the key to providing flexibility. Each section of the output is presented as a module with its own actions. This allows both the entire set of results and/or just a single section to be shared with other users or into a workspace, where further discussion and annotation will occur. They can also be downloaded in convenient formats.
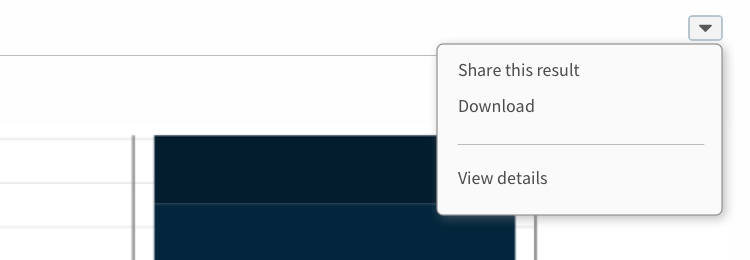
Whichever action they choose, the Touchpoint has delivered machine-learning-driven analytics results that will help them make business decisions.
Extending the Platform
The design roadmap for Touchpoints extended to encompass the business user’s working habits.
On the Dashboard
Designed in an earlier release, Chorus’s Dashboard System was conceived to be flexible and to incorporate new content modules (“widgets”) as opportunities arose.
The Touchpoint product scenarios presented a great case for this. With a new widget, the business user could now set up their personalized home page to include specific data-driven analytics right at login.
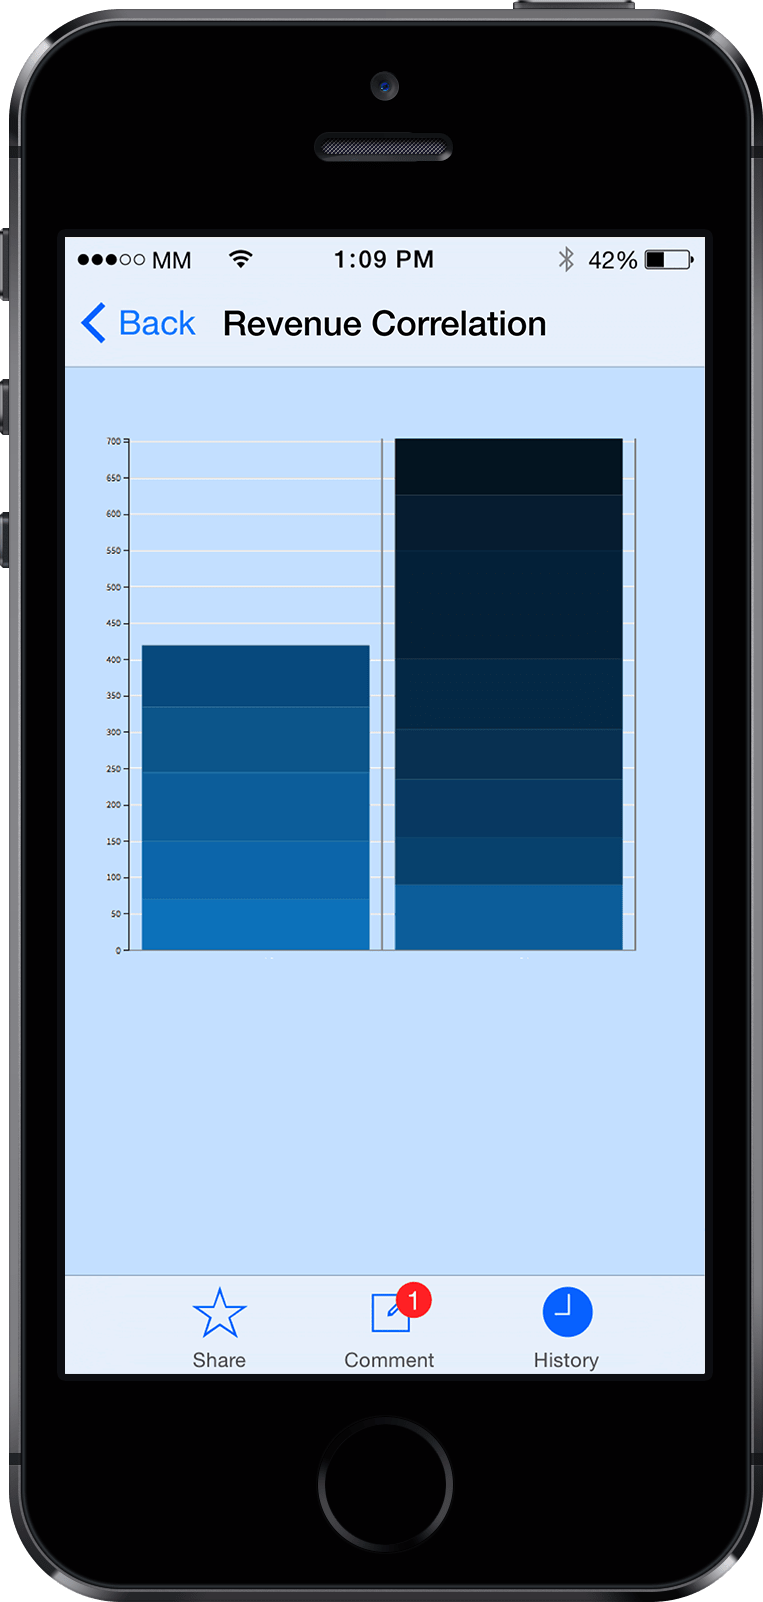
On Mobile
The mobile ecosystem plays an essential part in the work-style of business users, and the ability to access analytic insights while on-the-go is highly desired.
The simplicity of the Touchpoint experience was designed to translate fluidly to mobile. A proof-of-concept mobile experience was designed, focused narrowly on the scenario of running a Touchpoint and getting timely results to make a decision. This covered the mobile-appropriate lifecycle steps from the catalog to the results.