Design of a new reporting and project analytics tool for the CollabNet Enterprise environment.
Project Background
At the time of this project, the software development industry was in the process of growing and maturing to become a recognized integral part of all companies, not just "software product" companies. Application Lifecycle Management (ALM) emerged as a new concept model for labeling and tracking the lifecycle of software development.
Collabnet Enterprise Edition (CEE) already had full-featured tools for the developers, but they were “silos,” and there was no insight into what was happening in those tools.
As a step in product maturation to embrace ALM and address a gap in the feature set, Project Metrics was conceived and designed as a new integrated capability to generate reports and visualizations of key project activity metrics for project/product managers and project team members (developers, testers, and observers).
Design Challenges
The project metrics design concept was not defined to be an all-inclusive reporting tool, and it was not intended to replace either stand-alone reporting applications or Excel (there was a separate effort to build an api for external tools).
Instead, it was just-enough reporting on pre-defined metrics, primarily for project/product managers who were already creating reports and charts manually for the rest of the team and stakeholders.
There were two main user experience challenges to designing Project Metrics:
- How to create a report
- How to save a report
Creating and Defining Reports
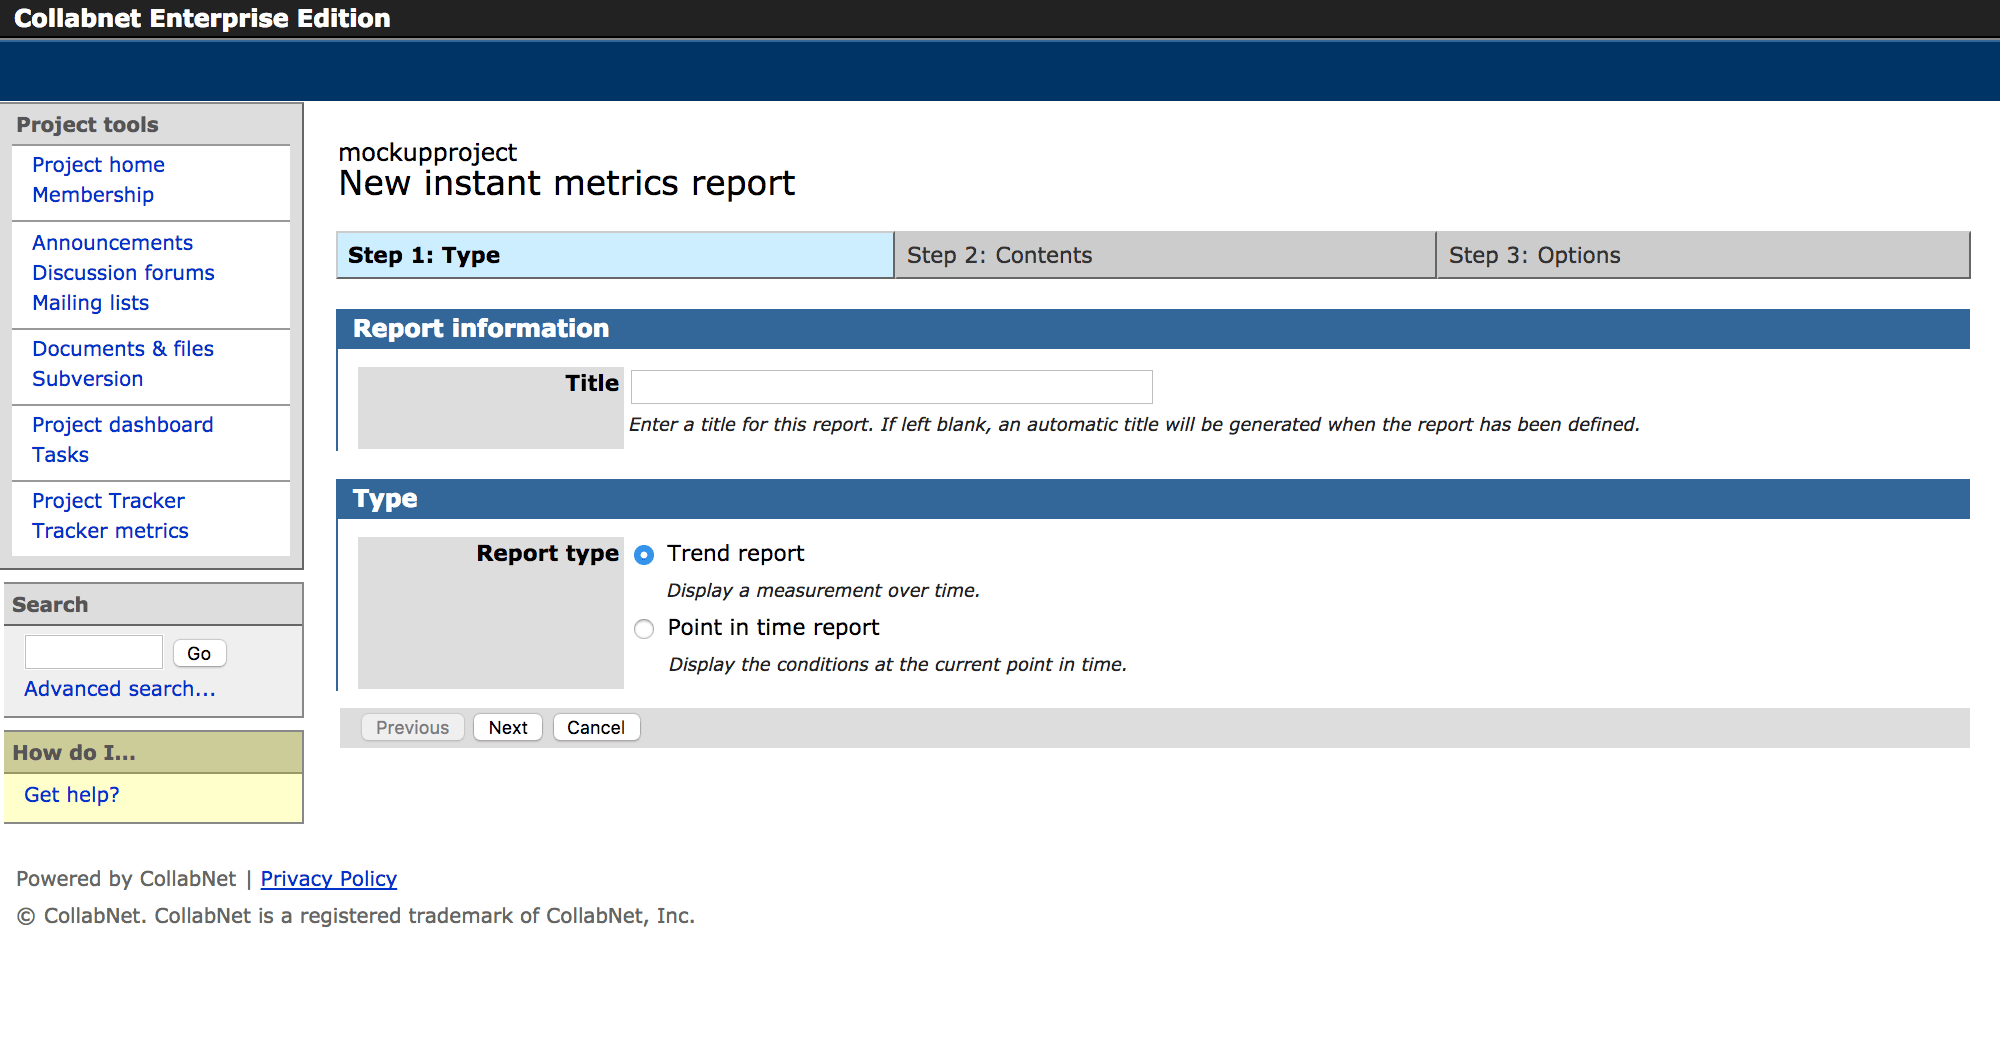
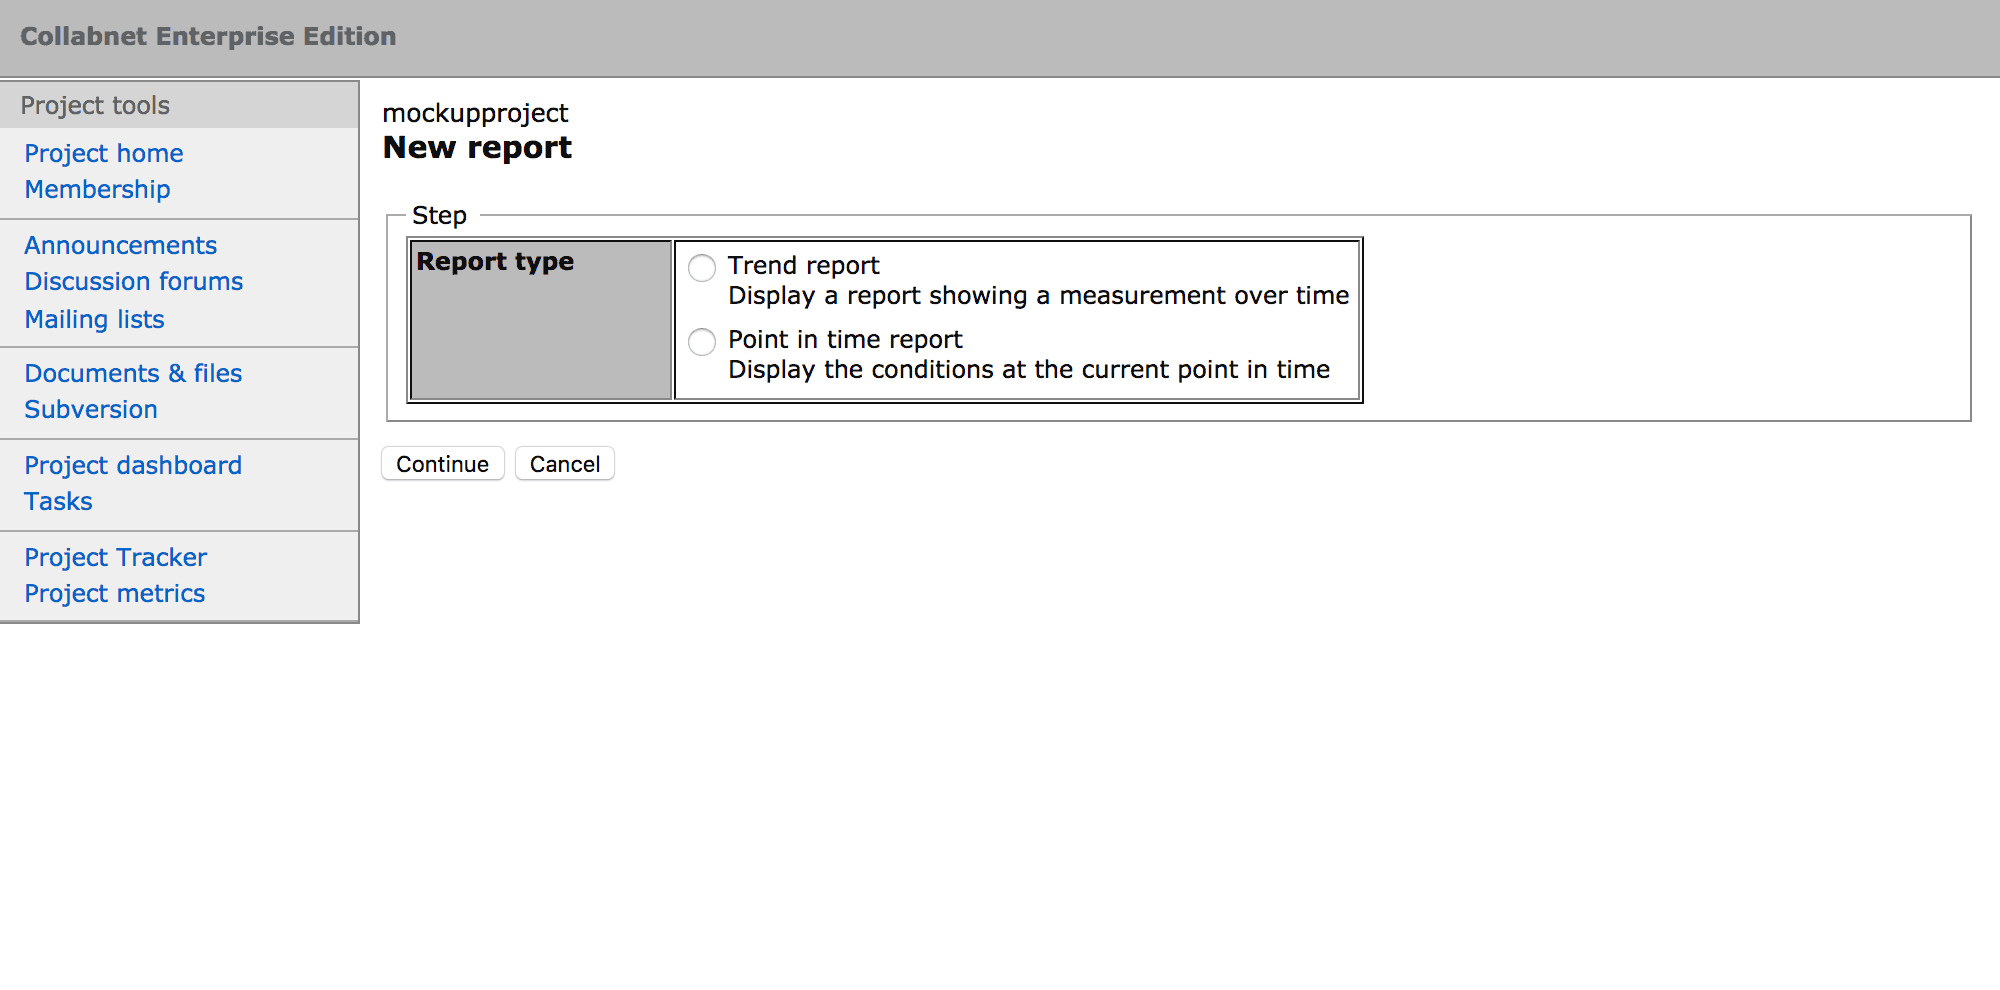
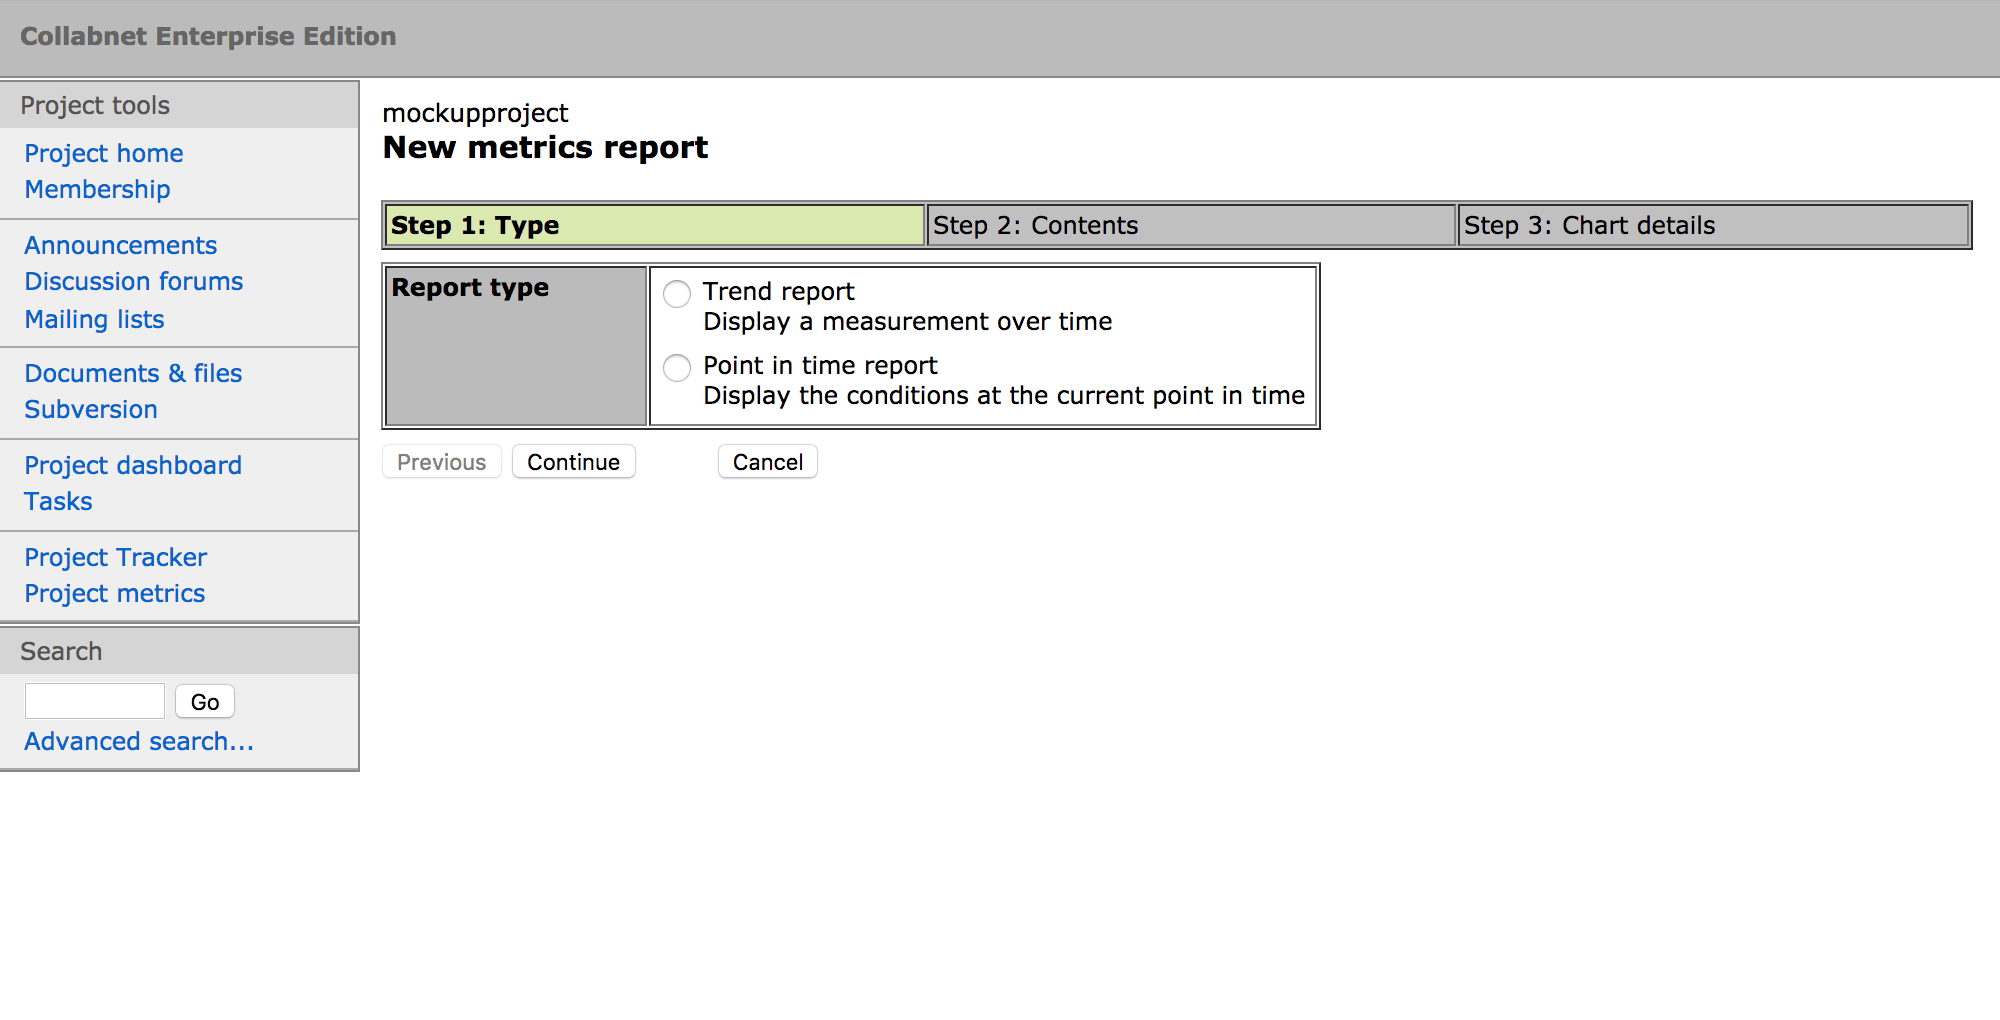
Since the scope of the reporting and measurements was constrained, the creation process could be distilled down to a wizard pattern with three steps:
- Select the report type (e.g. trend)
- Select what the report should measure (e.g. which issue types)
- Specify the report options (e.g. time frame)
Design Out Errors
Within the report creation process, as each step was submitted, the choices available in the next step dynamically updated, offering only options that were appropriate for the preceding choices. This reduced the task to be as simple as possible, making the sequence fast and easy for anybody.
Furthermore, it neatly benefitted the overall product experience because misconfiguration and incompatible selections were “designed out.” A report could return zero results and that would be a valid report (e.g. there are no open issues this week). But an invalid report that returned errors could not be created.
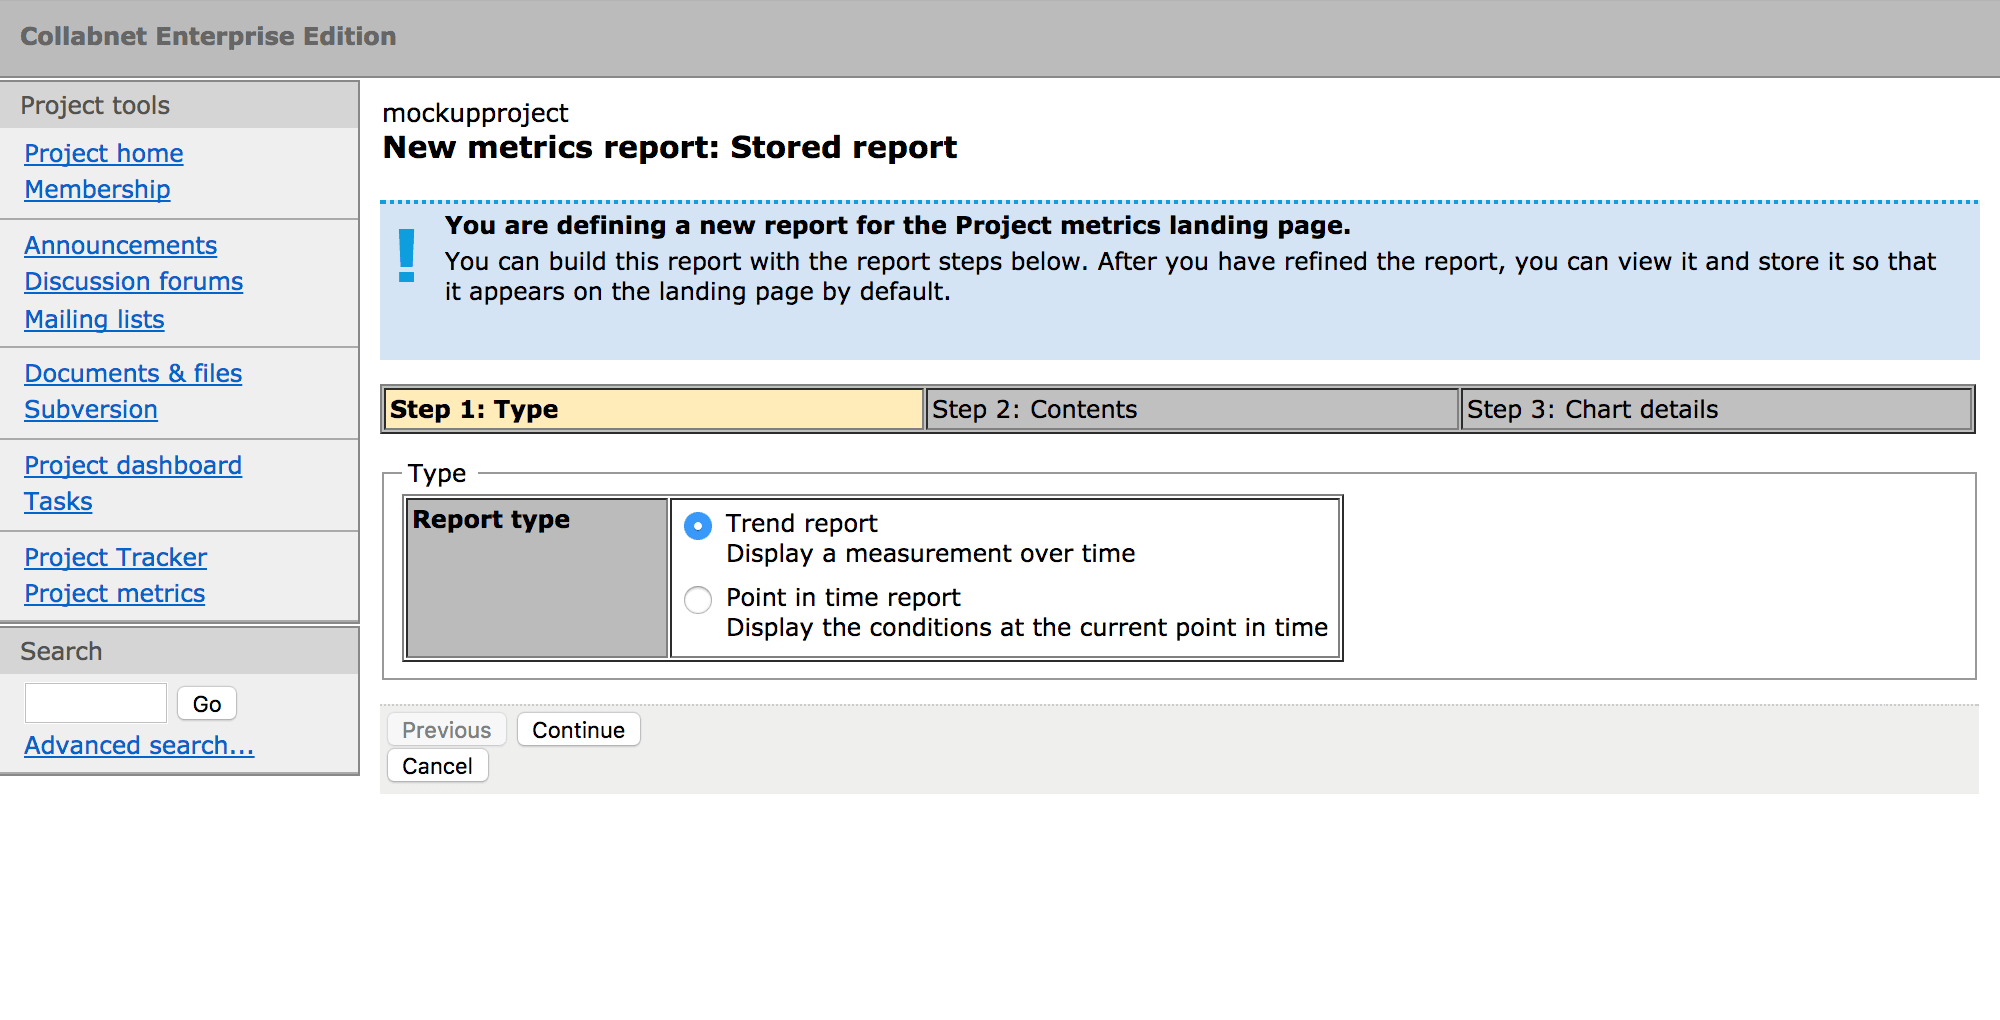
Saving and Managing Reports
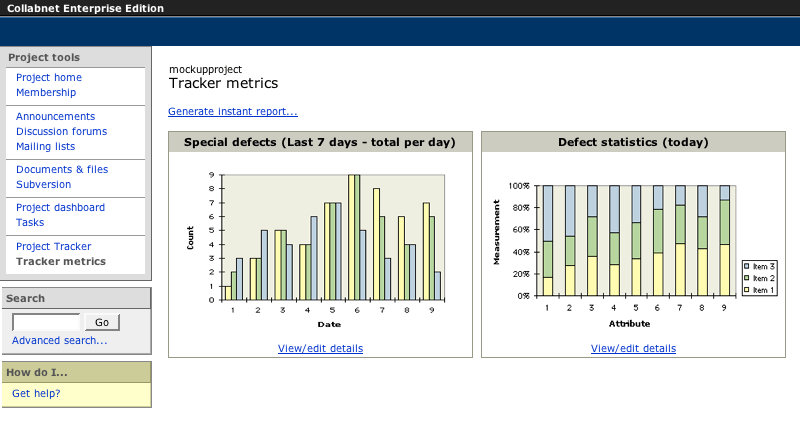
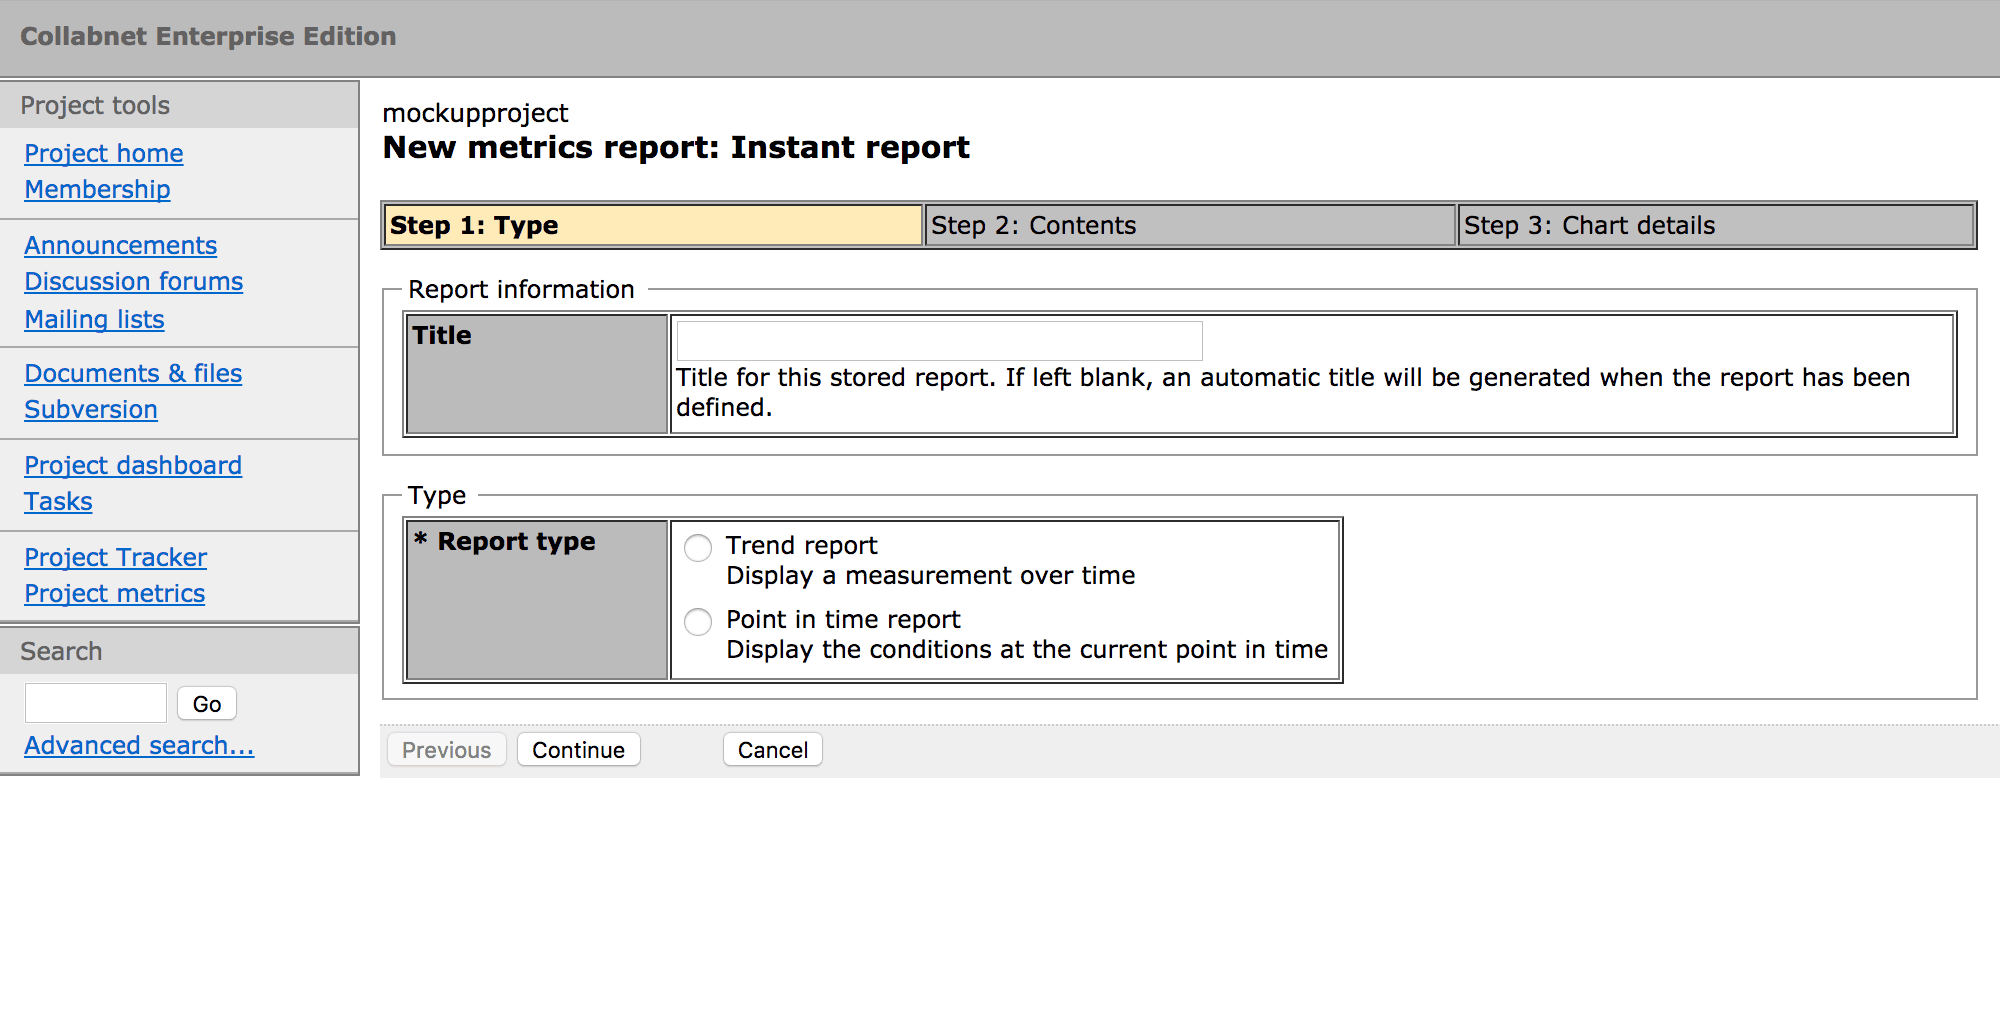
Ad-hoc reports are necessary so that a person can make an inquiry on-the-fly, and this capability was provided with the “Instant Report” action.
But people do not want to have to go through the process of defining a report every time they want to see the results. That would be absurd. So it is a foregone conclusion and a user experience requirement that if reports are a feature of an application, then it must be possible to save a report and run it later, repeatedly.
Initial design proposals took this in the typical direction by considering a report file, or document, with the functions to manage files. And promptly abandoned this path.
Designing (and building) an entire file management system for reports, with all of the concomitant tasks for such a system (save, copy, delete, naming, permission checks, error handling, and so on) was not in scope. Nor was it desirable. That is not where value resided.
A concept was needed that would avoid the conventional requirements of a file management tool and still provide the capability that users expected: define a report and save it in a project.
The solution invented was to subvert the expectations of a report and focus on the goal of the user — viewing the report results.
Inventing a Report Module
Within CEE, project spaces had a lightweight template-based publishing system for creating project content, like meeting notes or status information that would be part of the communal project site.
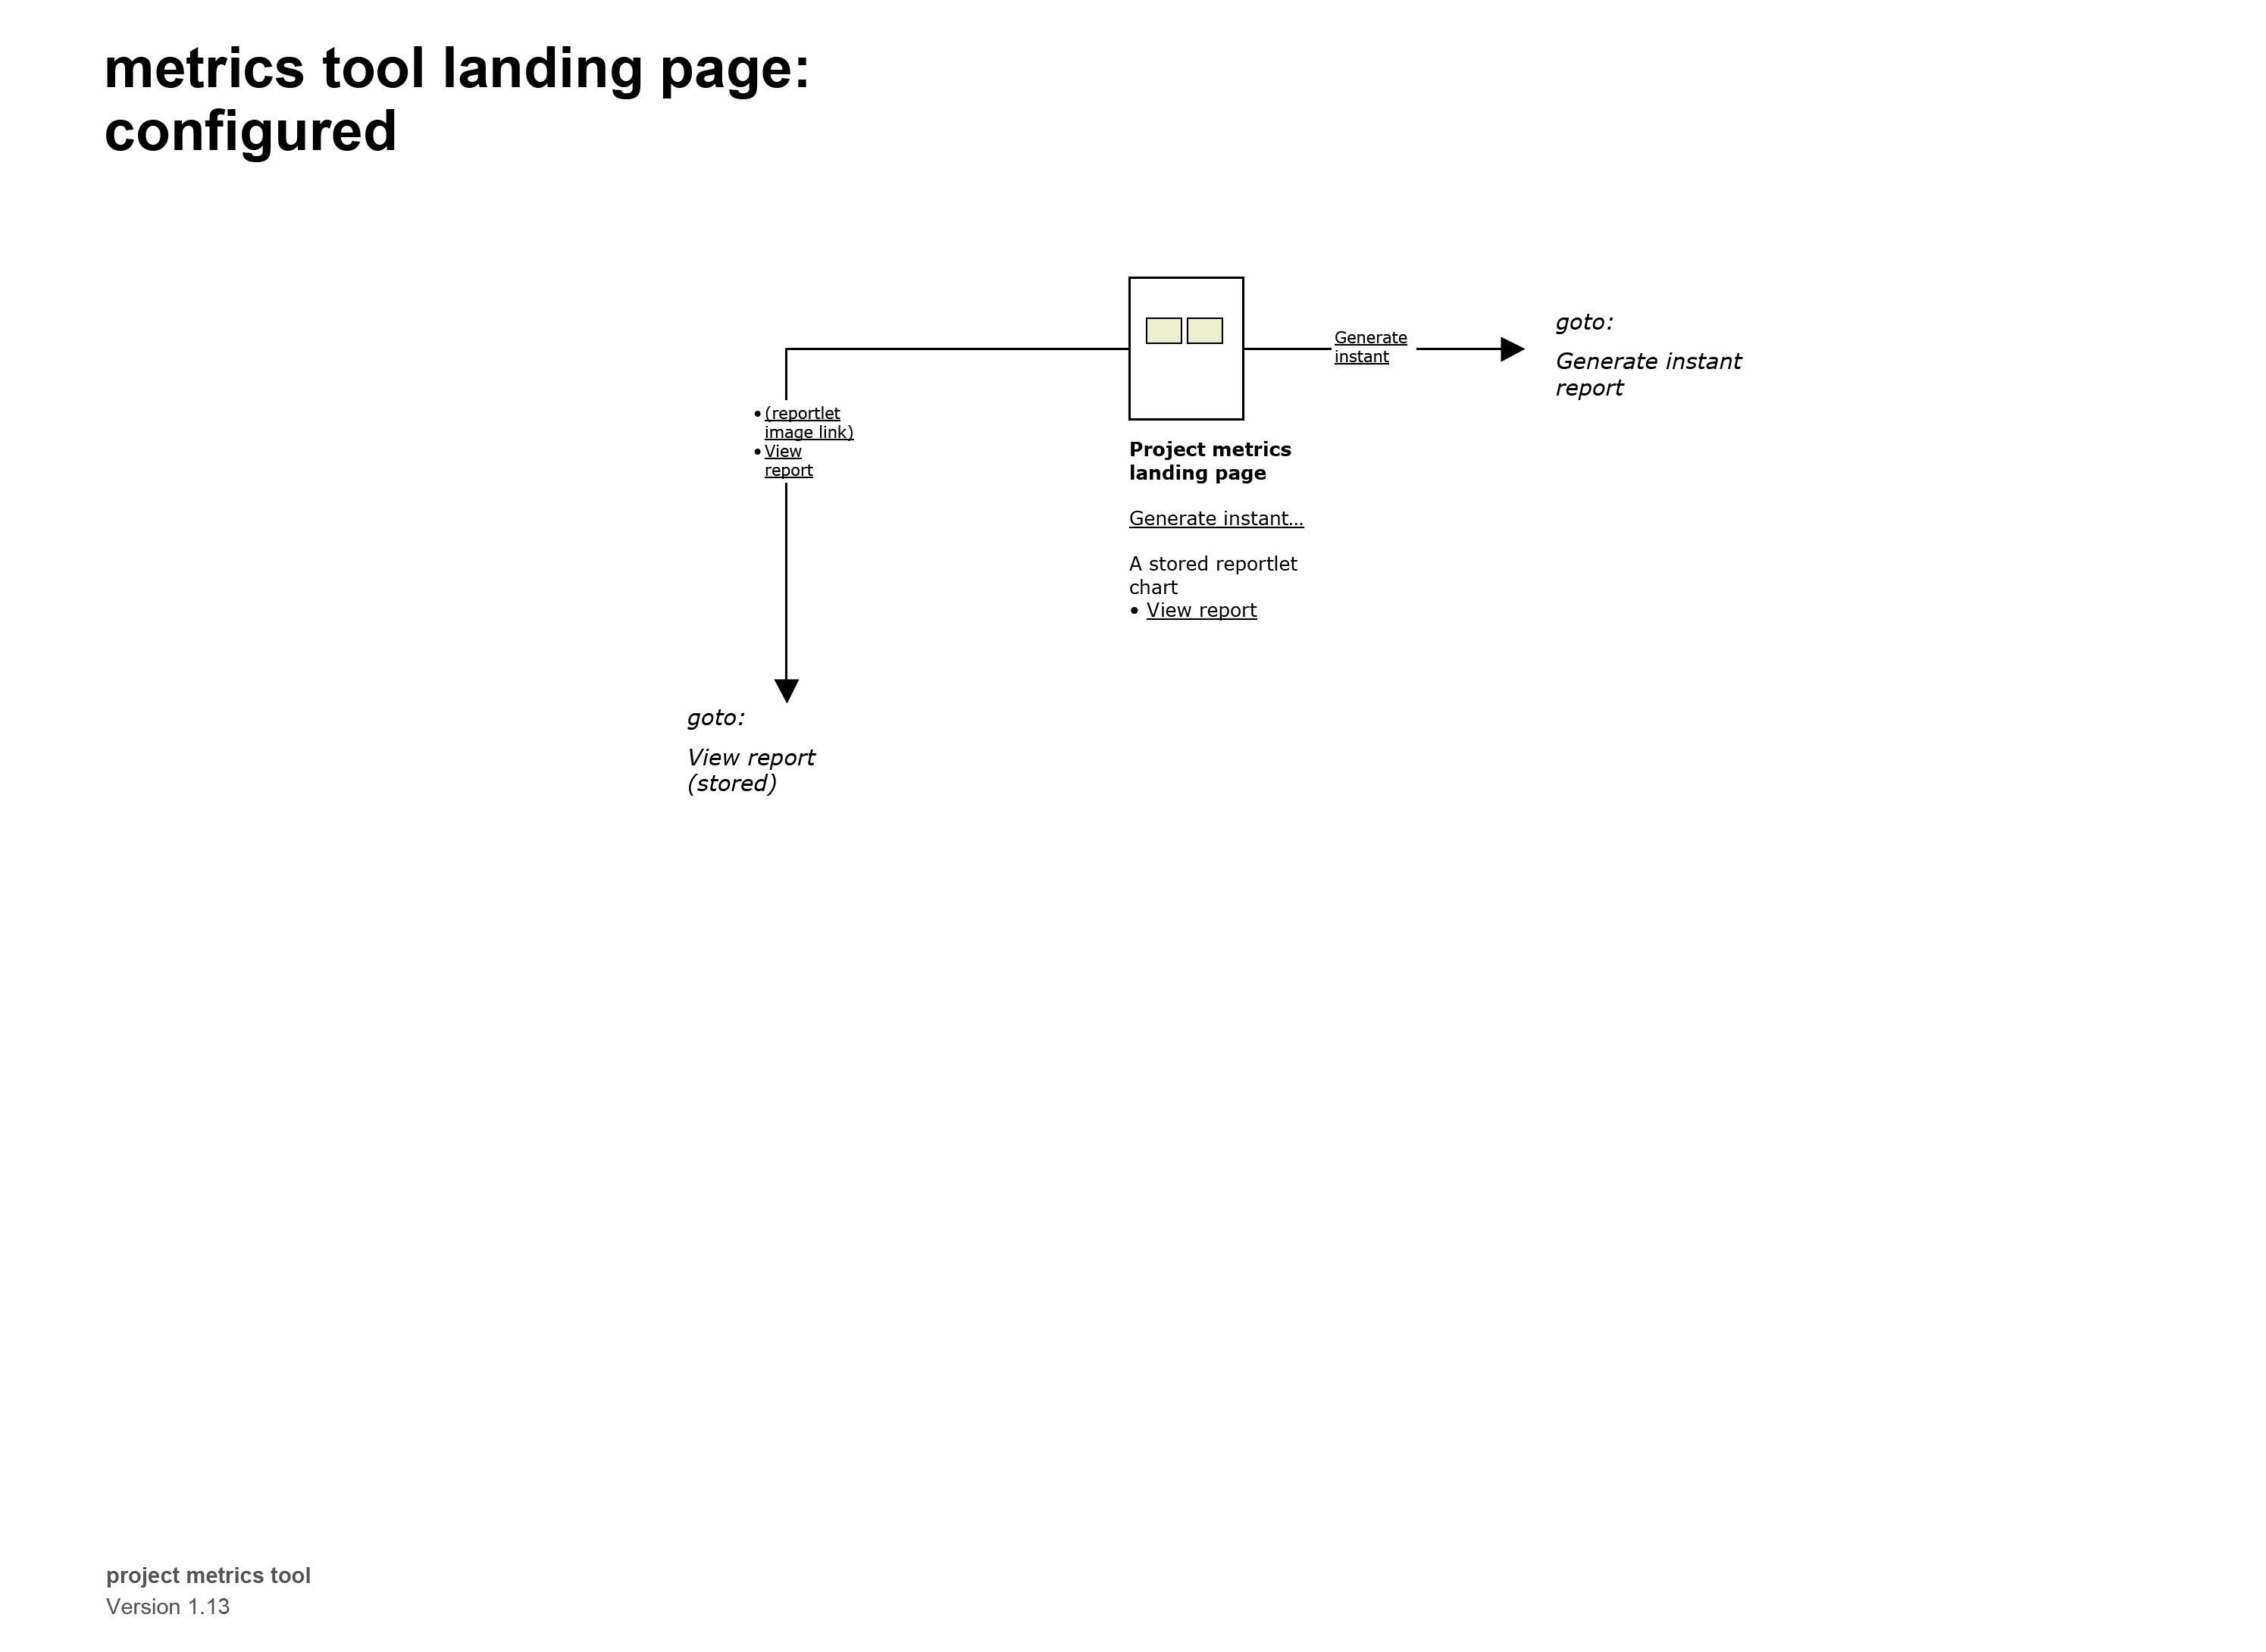
Project metrics seized on this by devising and designing a new report module, or page component, in the publishing system. The module could be added to any page, and it displayed on the page separate from any other free-form text/content. What the module really did was to define a “space” — a receptacle or container — where a report could exist. One container = one report. Eleven reports? Add eleven containers.
This transformed the entire idea of what reports are and how they are saved. A metrics report became intrinsically linked to the project communications.
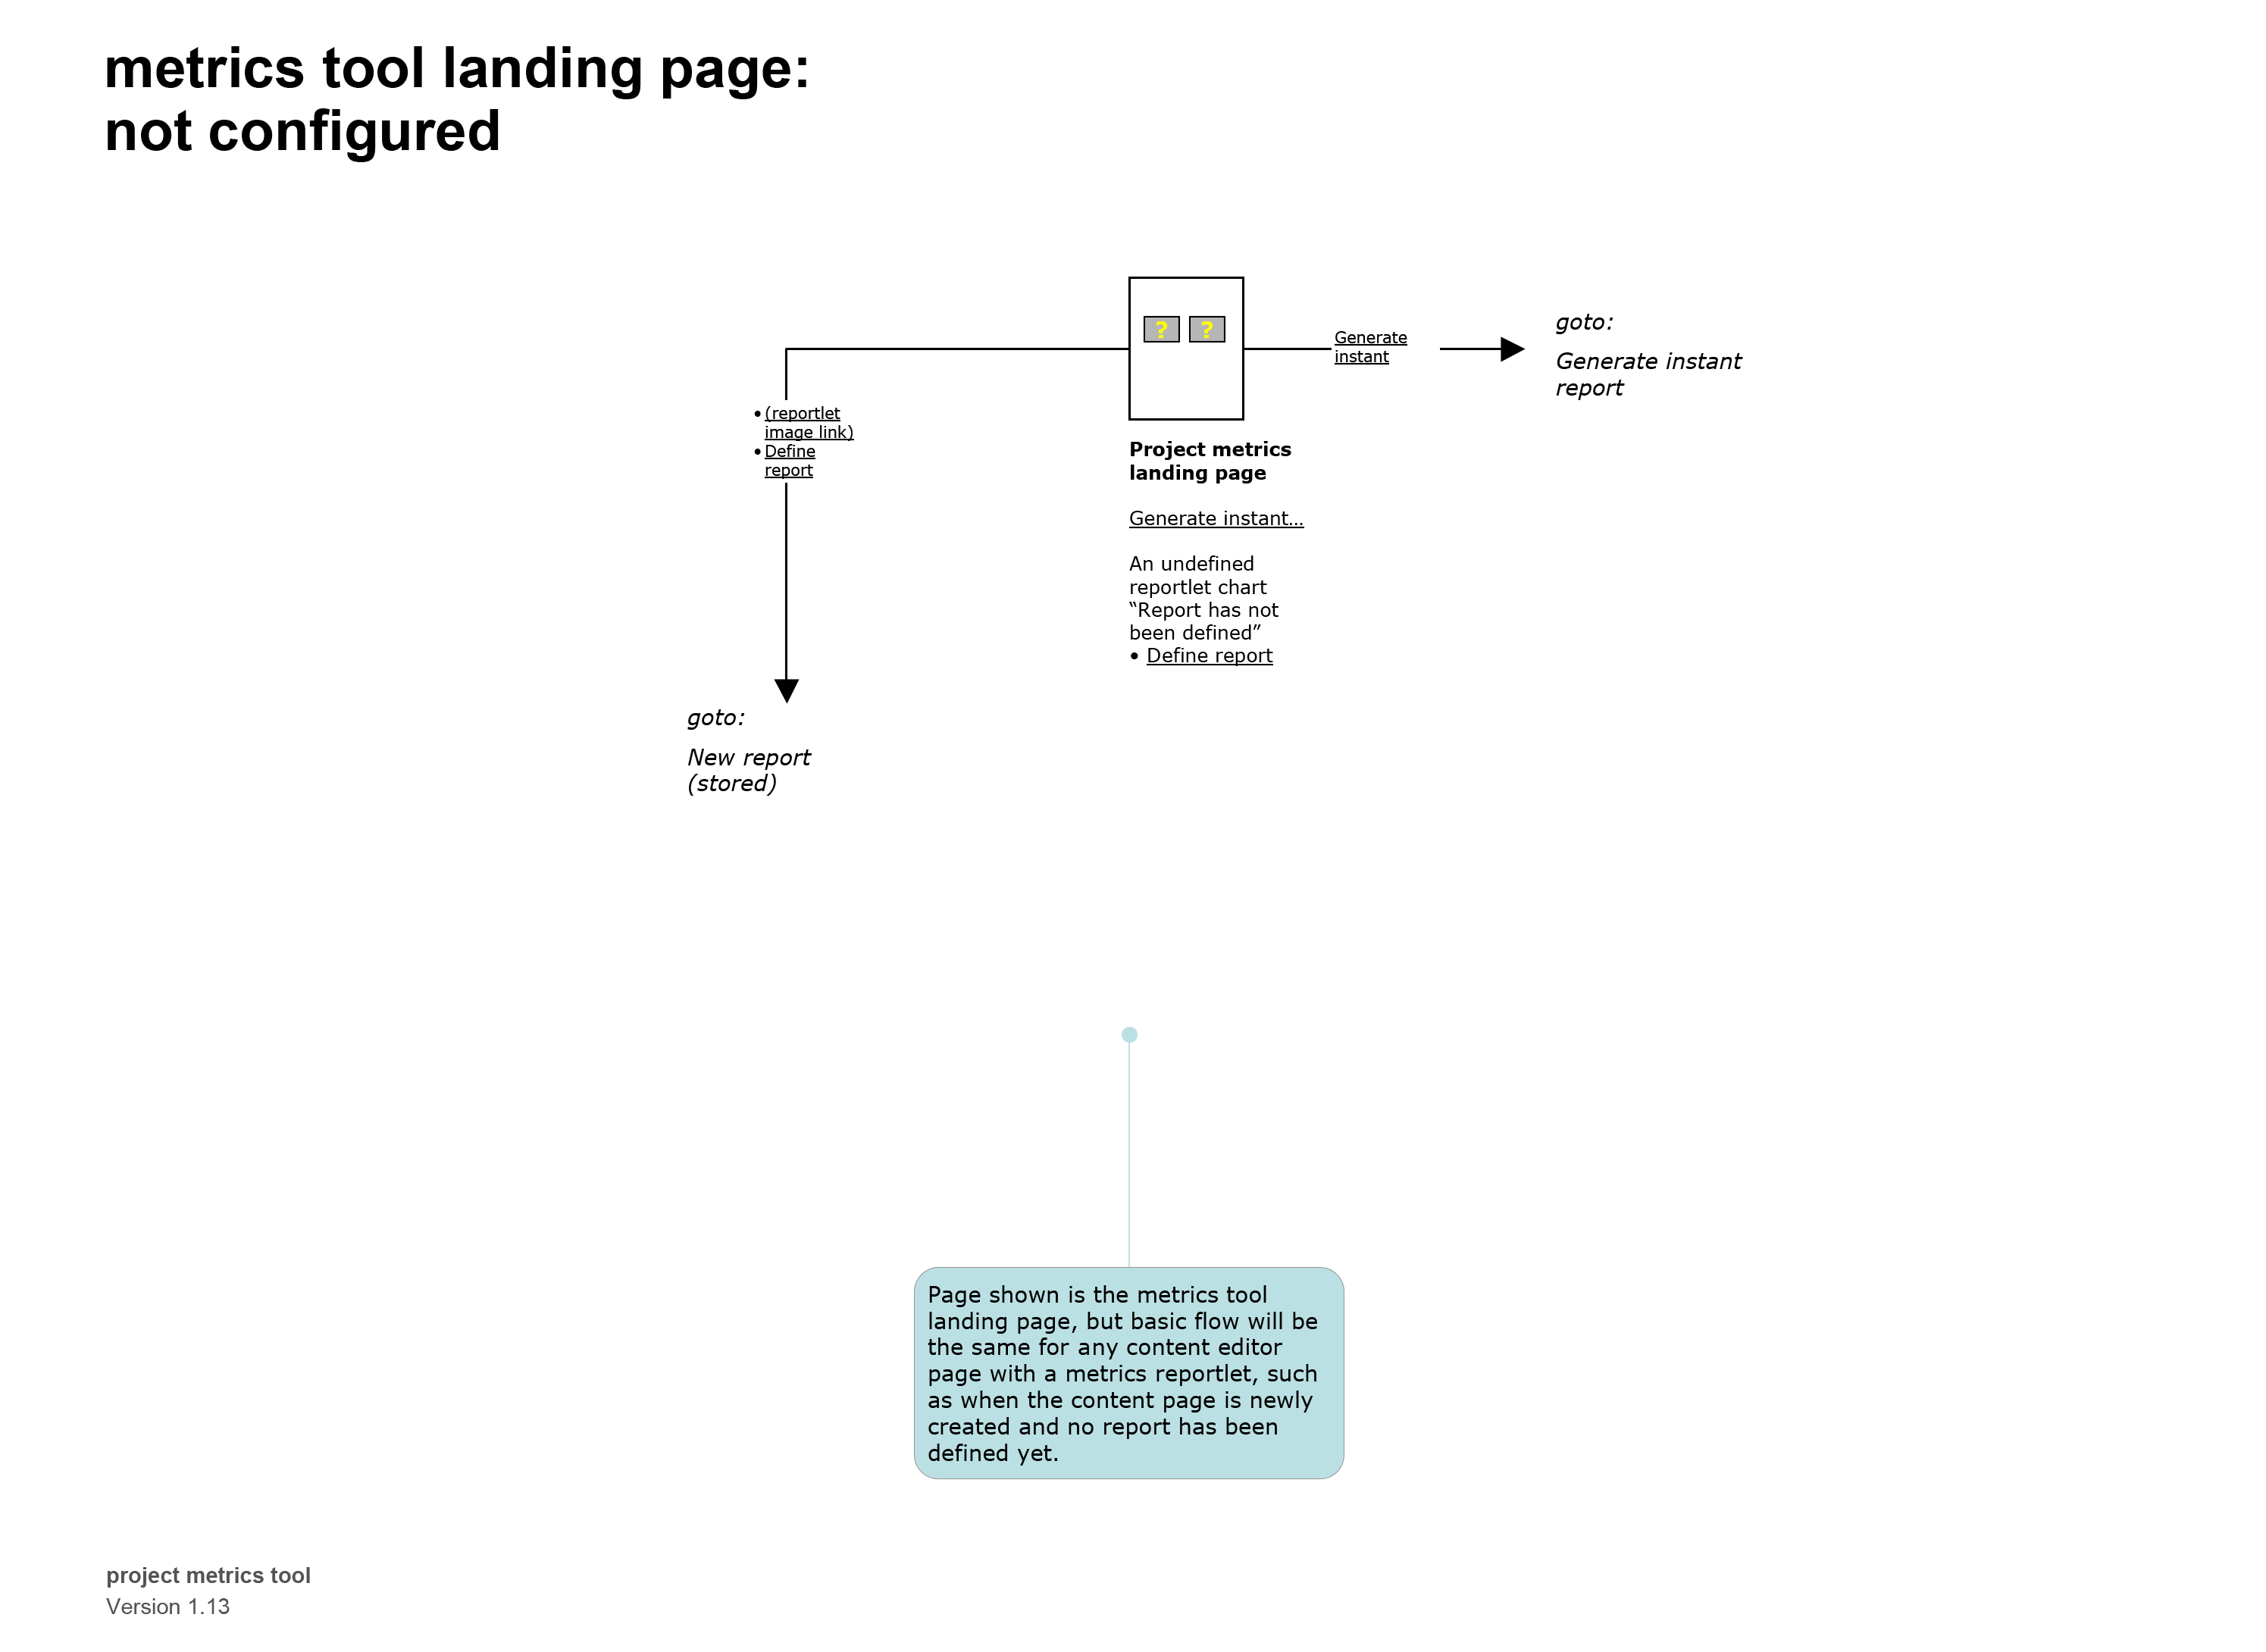
To Add Something New, First Make a Place for It
When a new report module was added to a page, it was empty, and the chart image displayed a message that it did not have a definition.
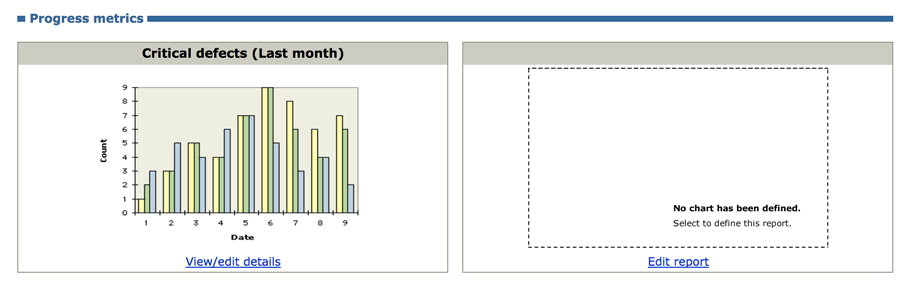
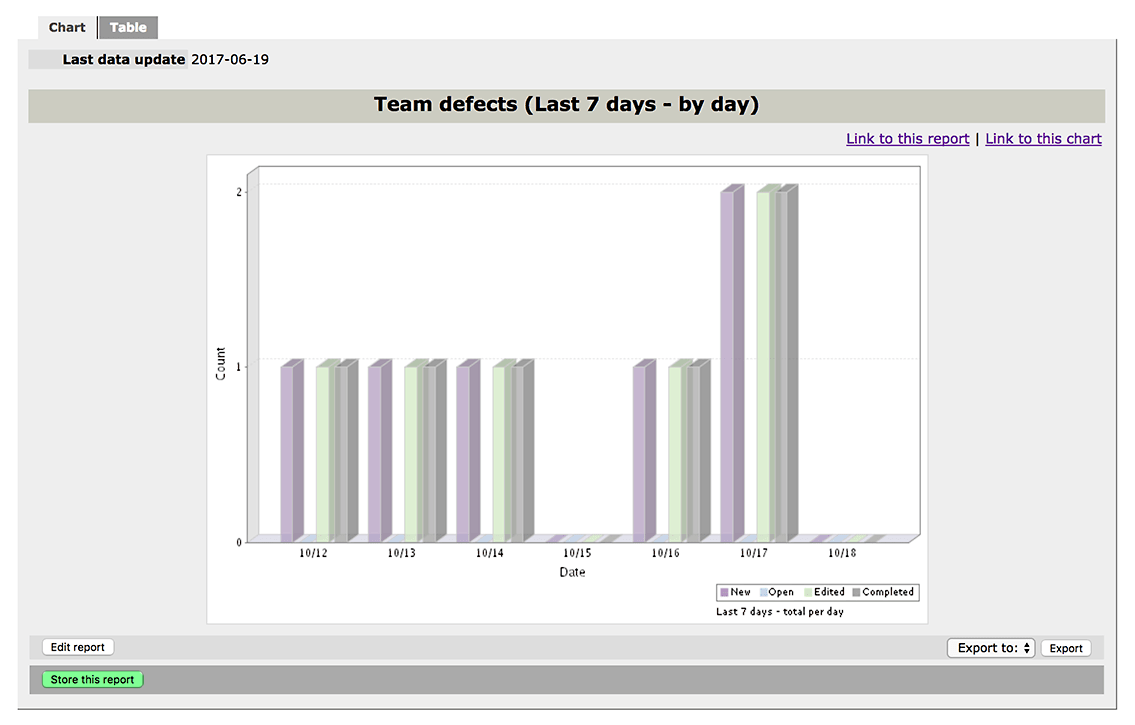
Clicking the empty chart brings the users to the report definition wizard, and when that (short) process is complete, the report chart displays. This behavior is exactly like the instant report, except that now the chart has an action available to store the report. Nothing more is necessary. The user is returned to the original page, and what was previously empty now displays the new report.
Developing the Design
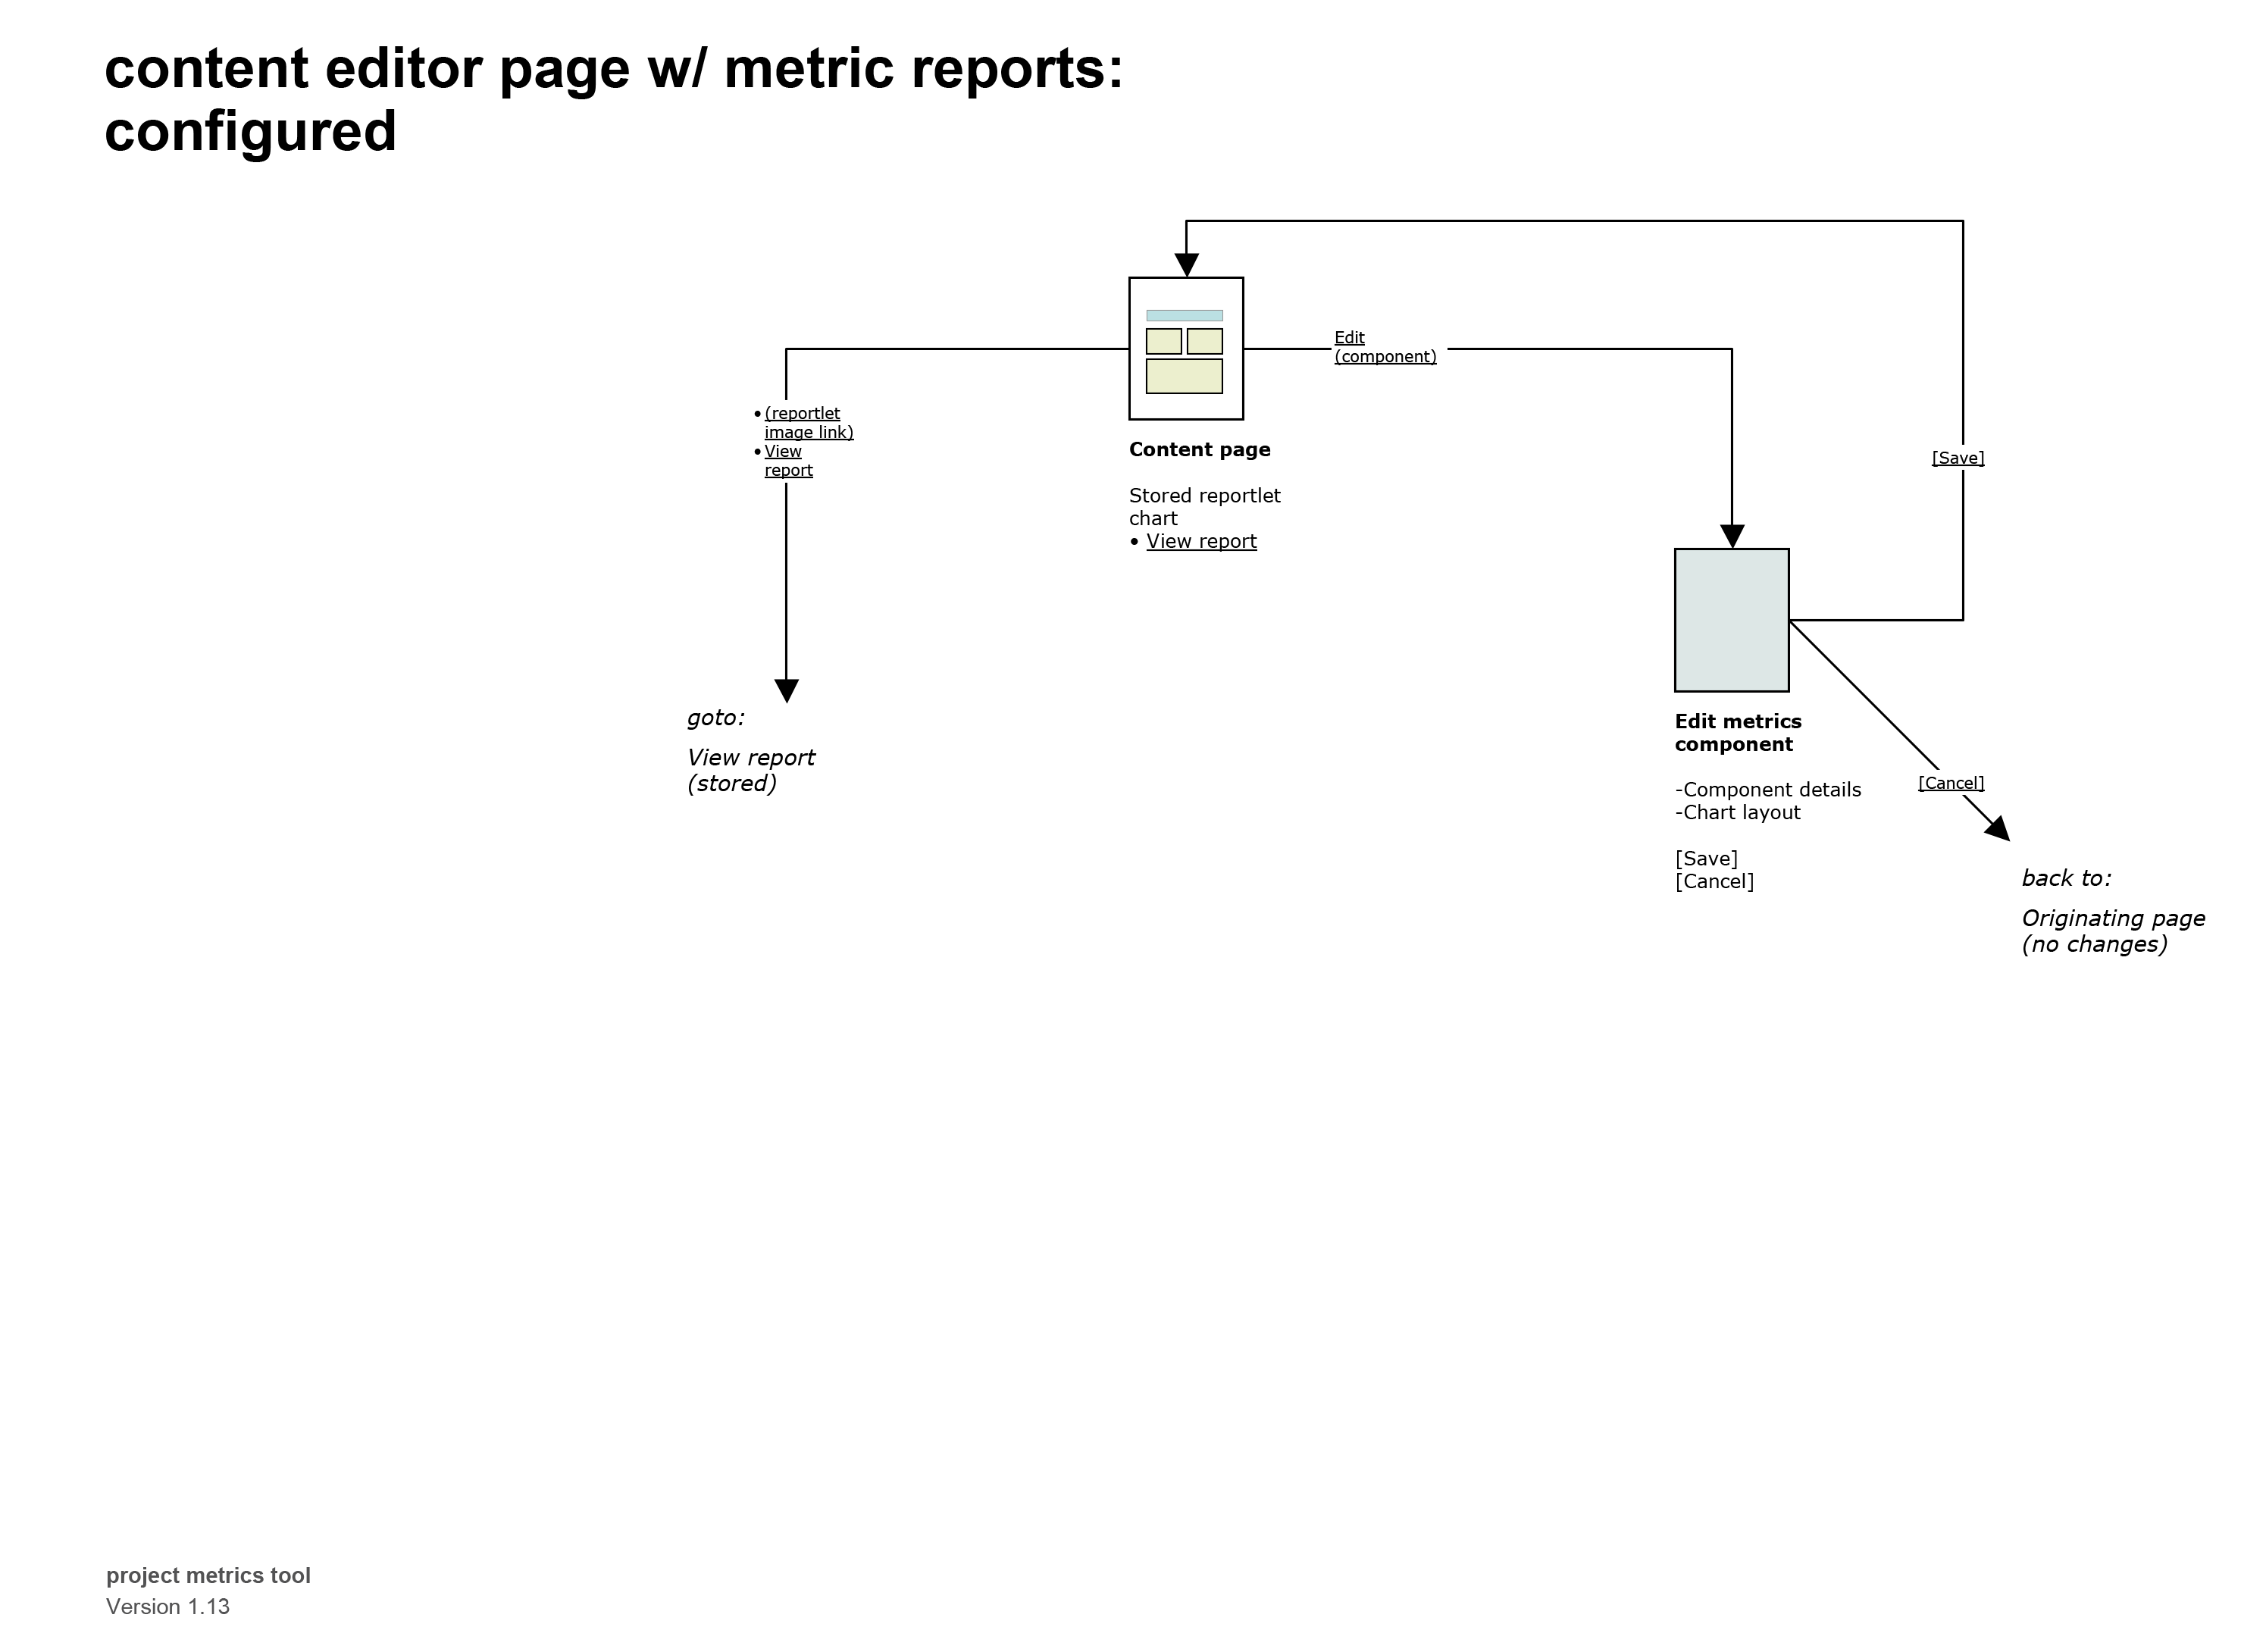
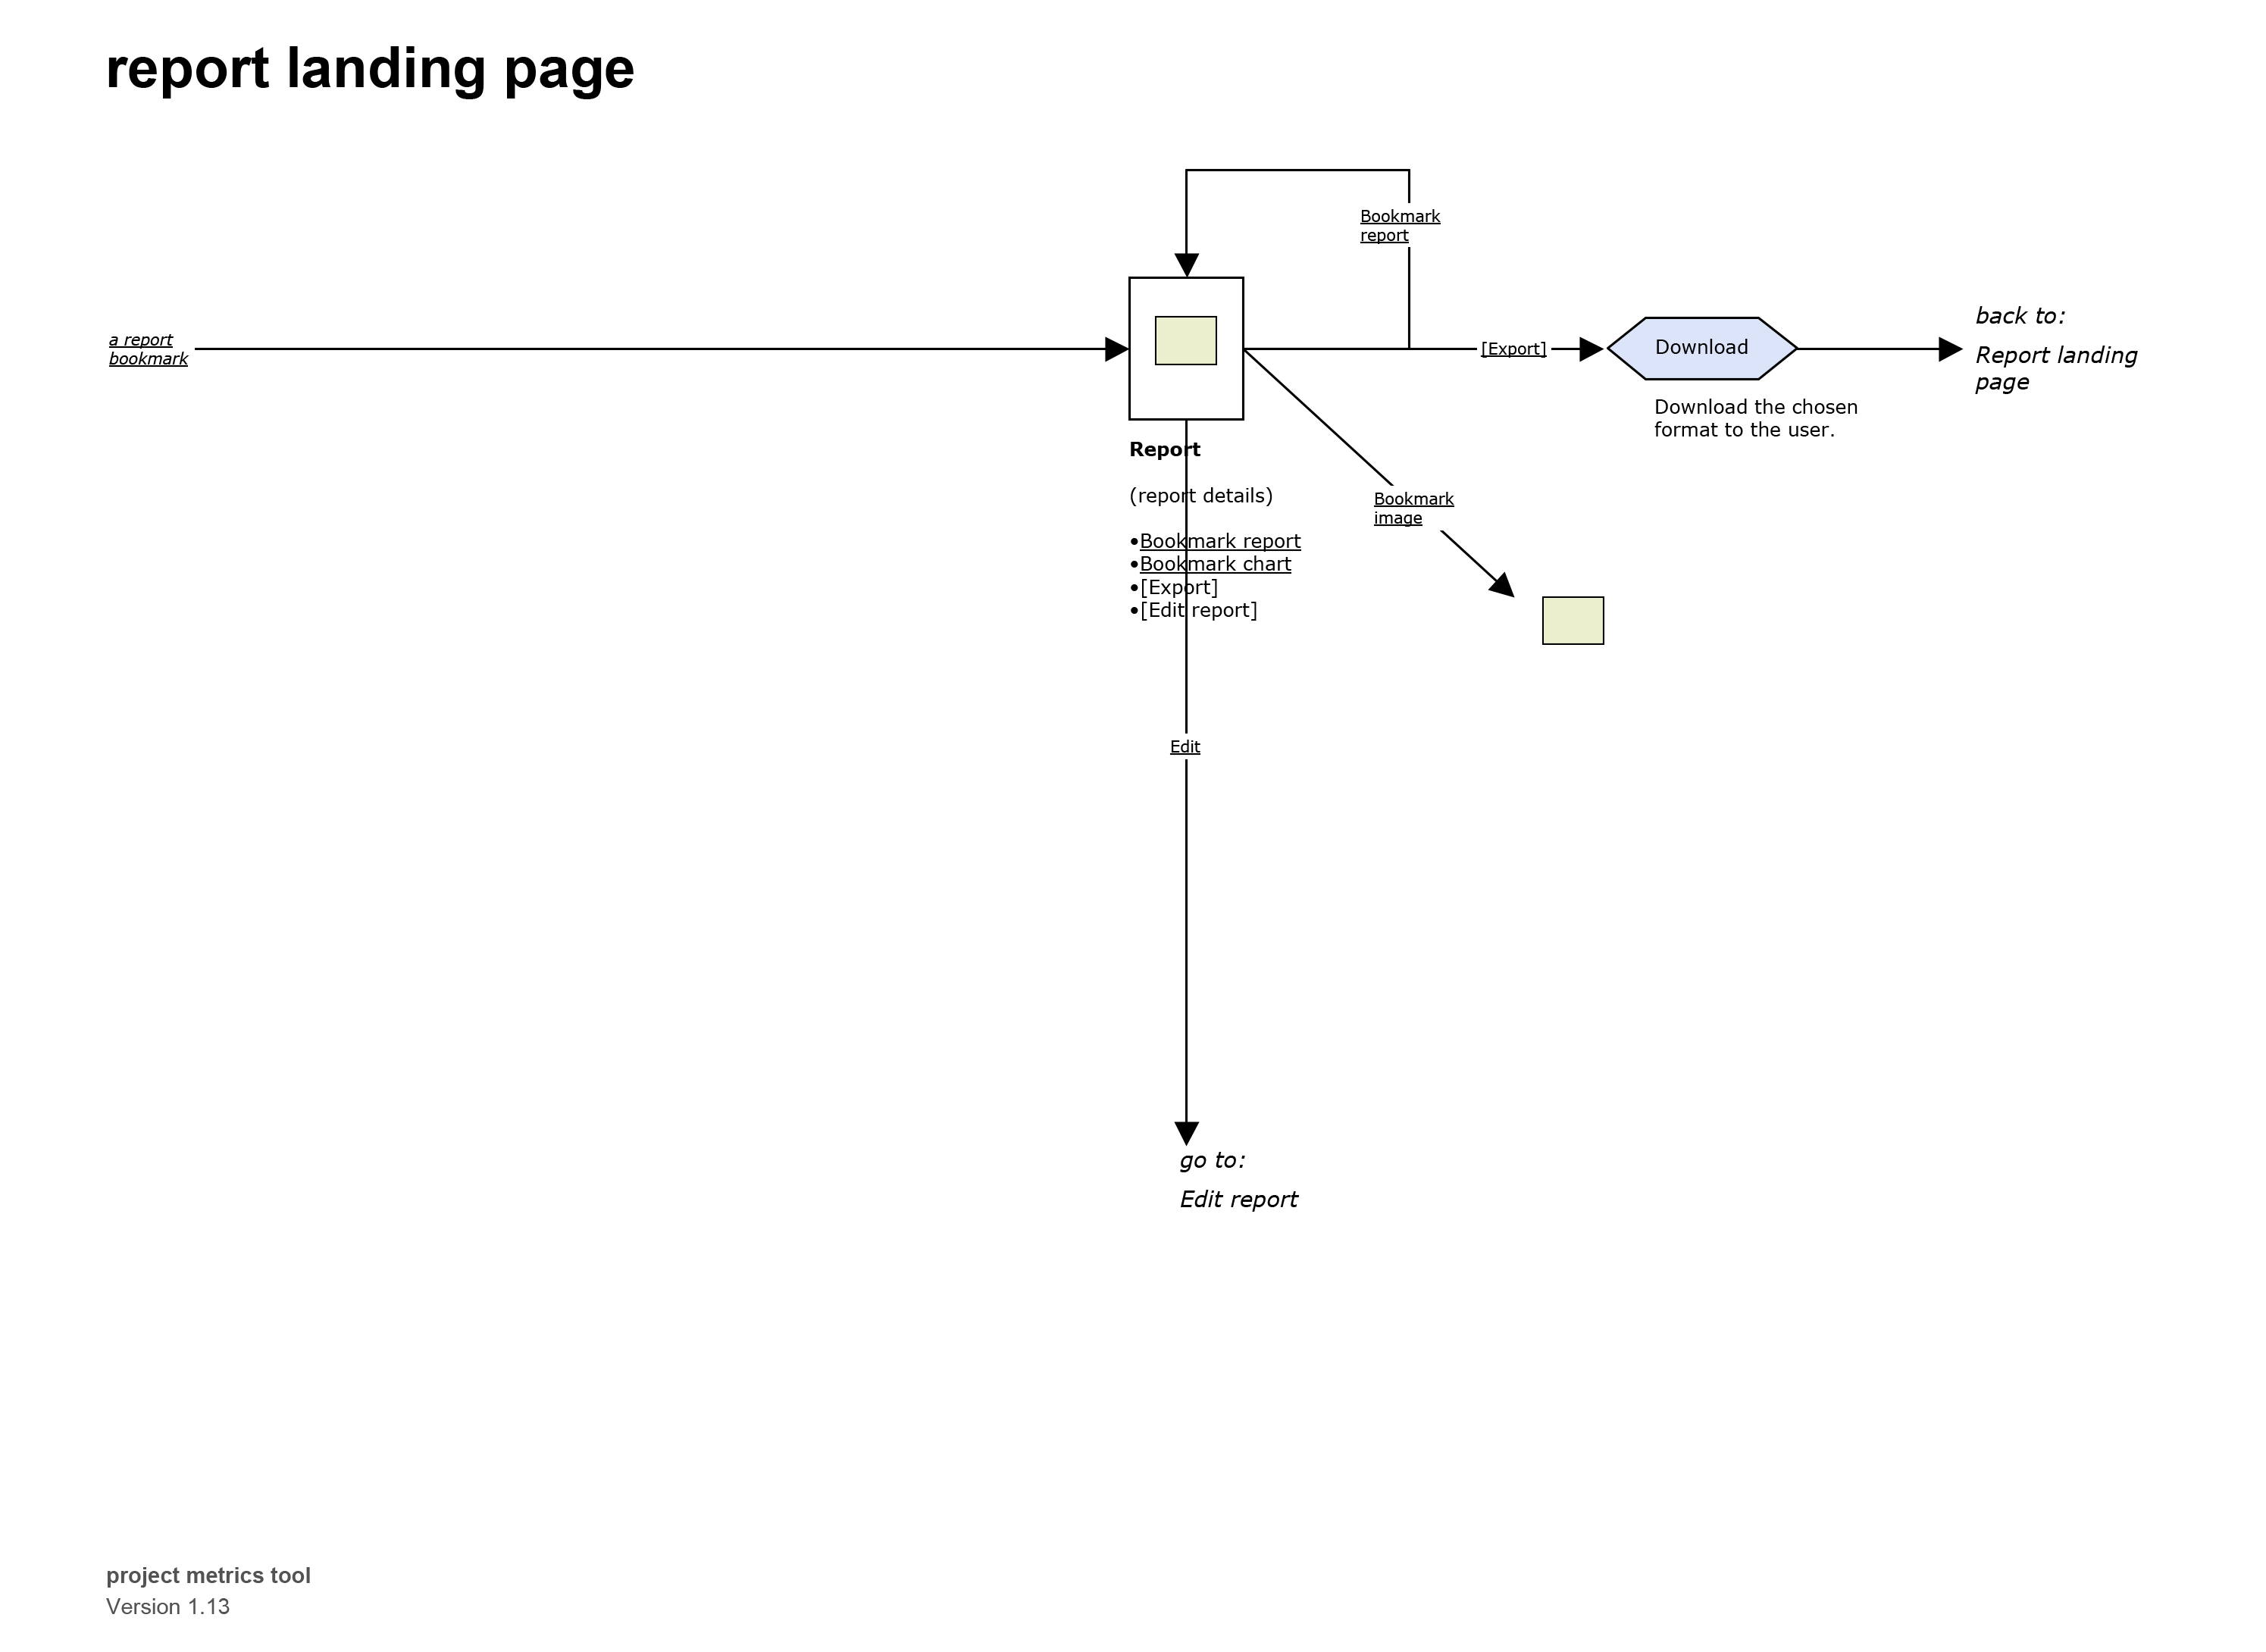
Interaction Architecture
A complete set of user flows was designed, mapping out the overall flow and architecture of the tool, and how the new features would integrate into the existing system.
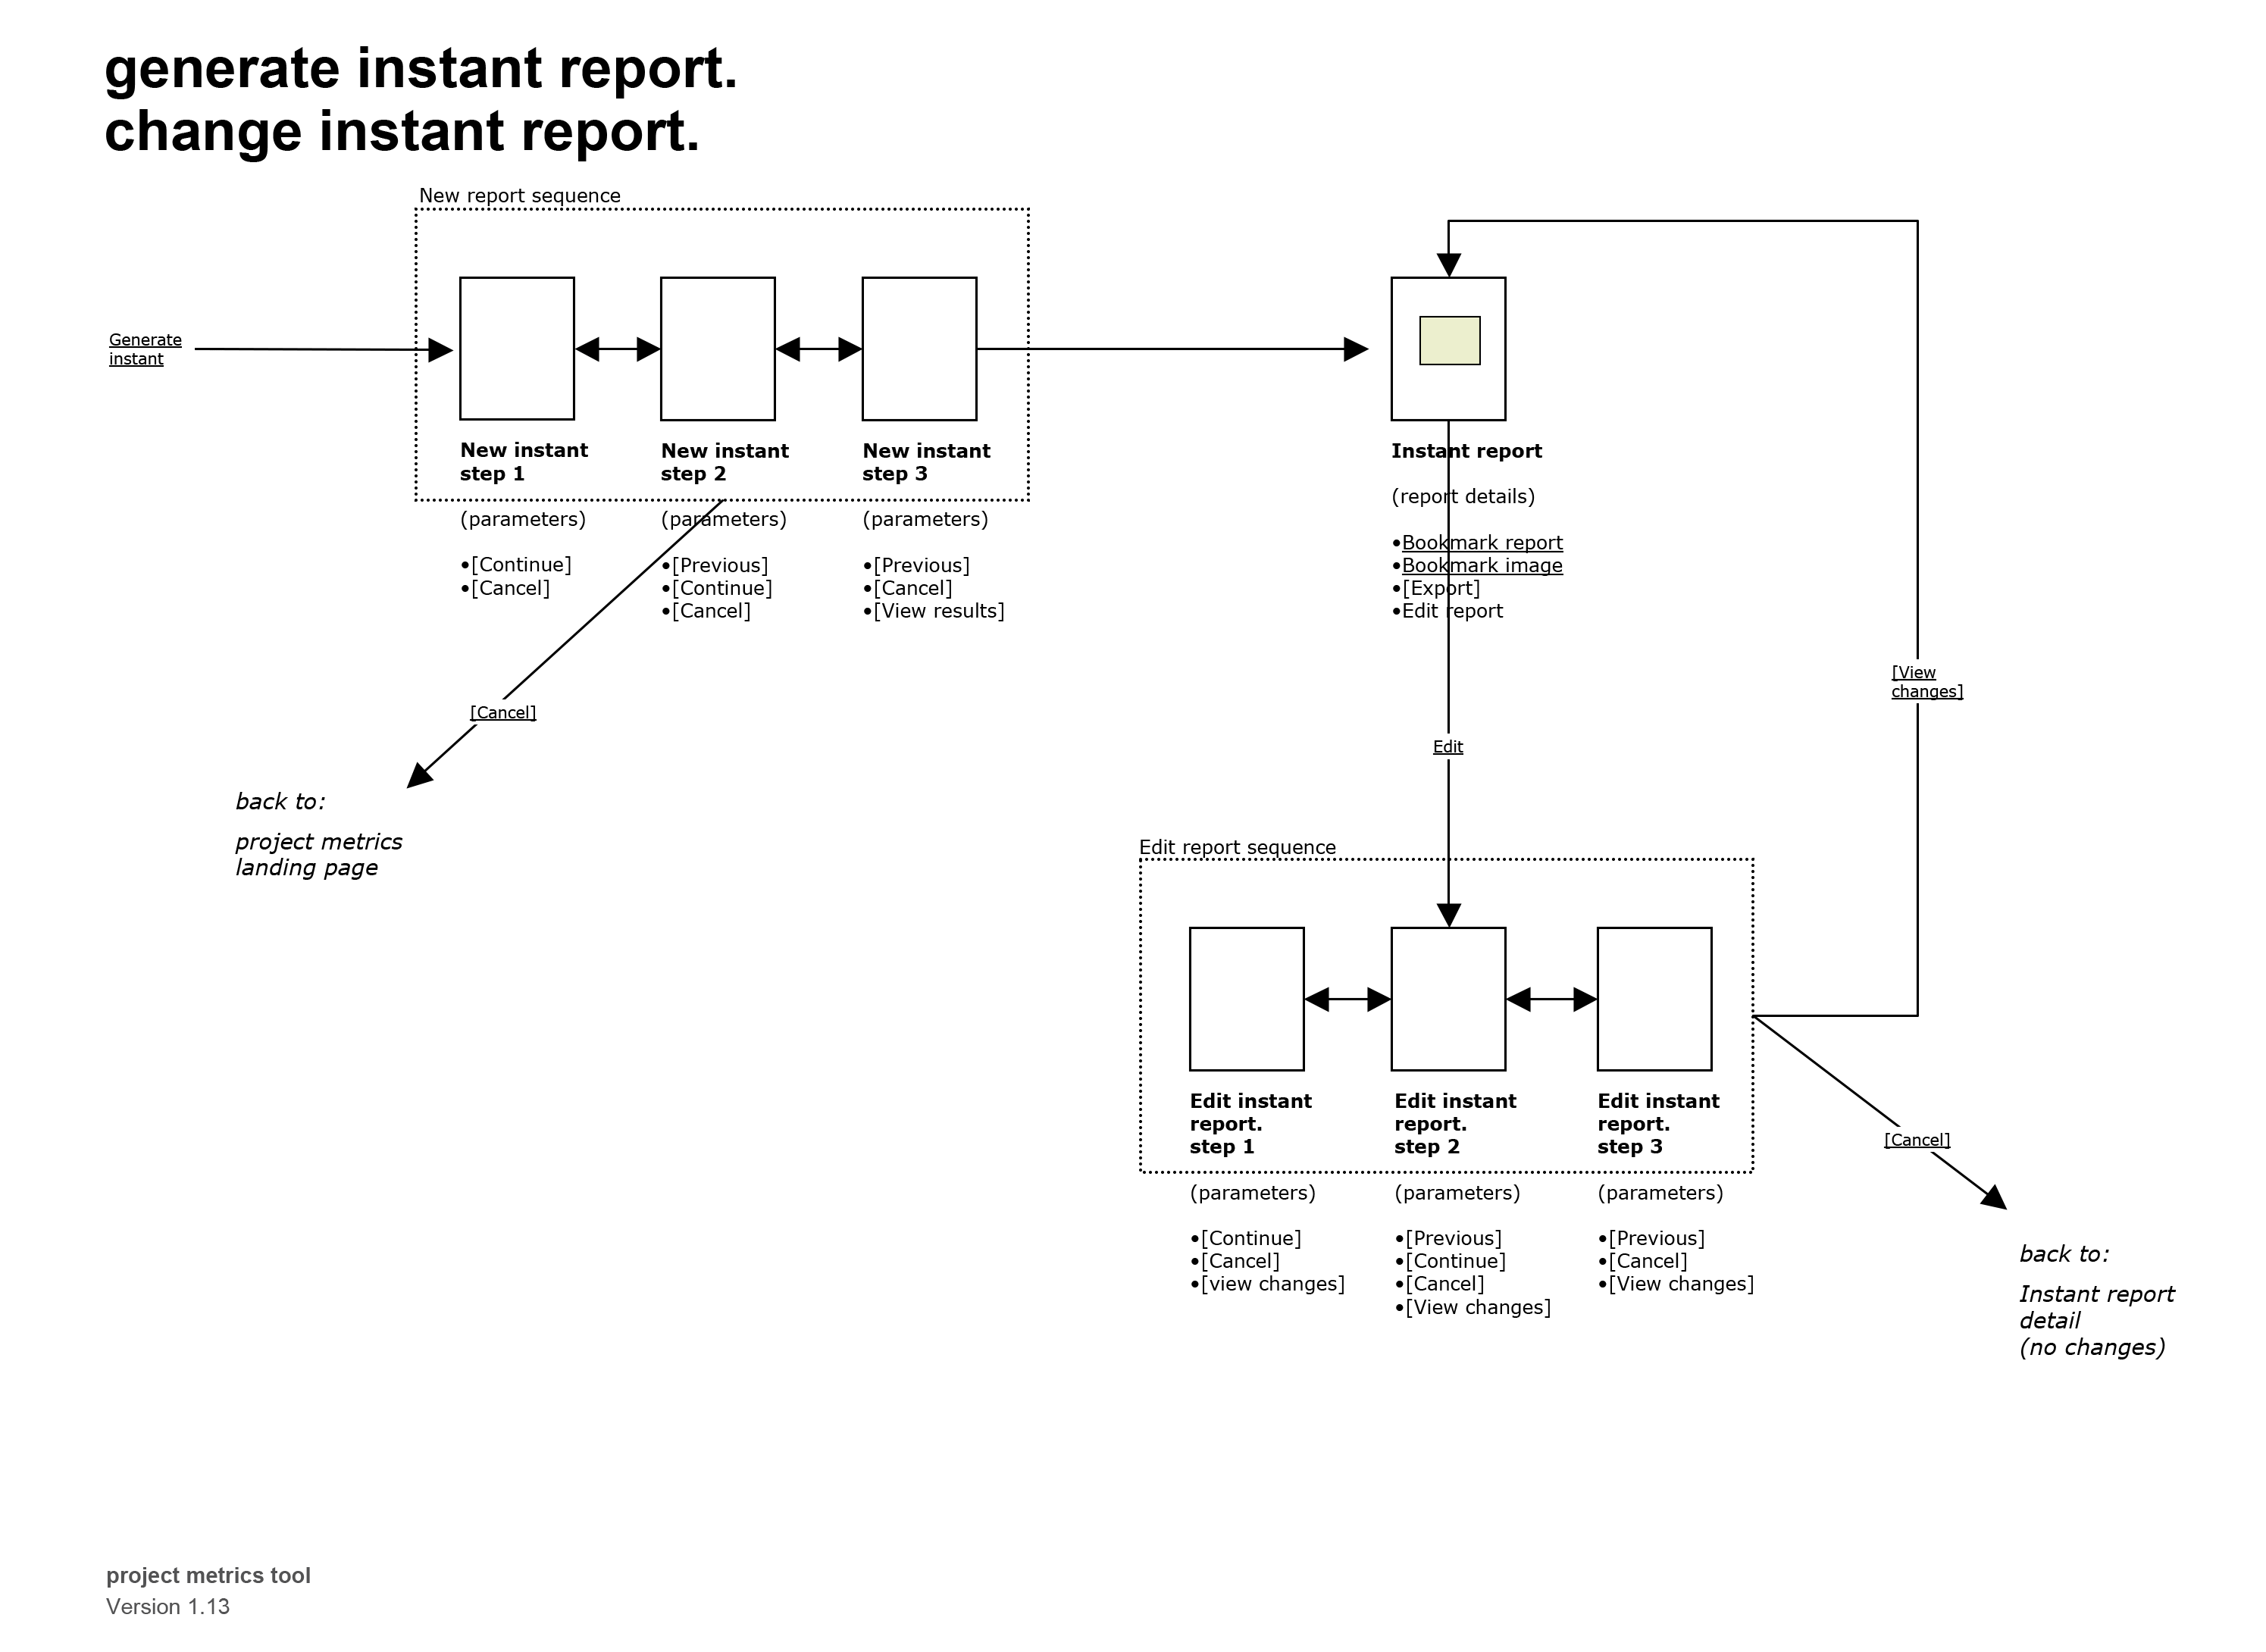
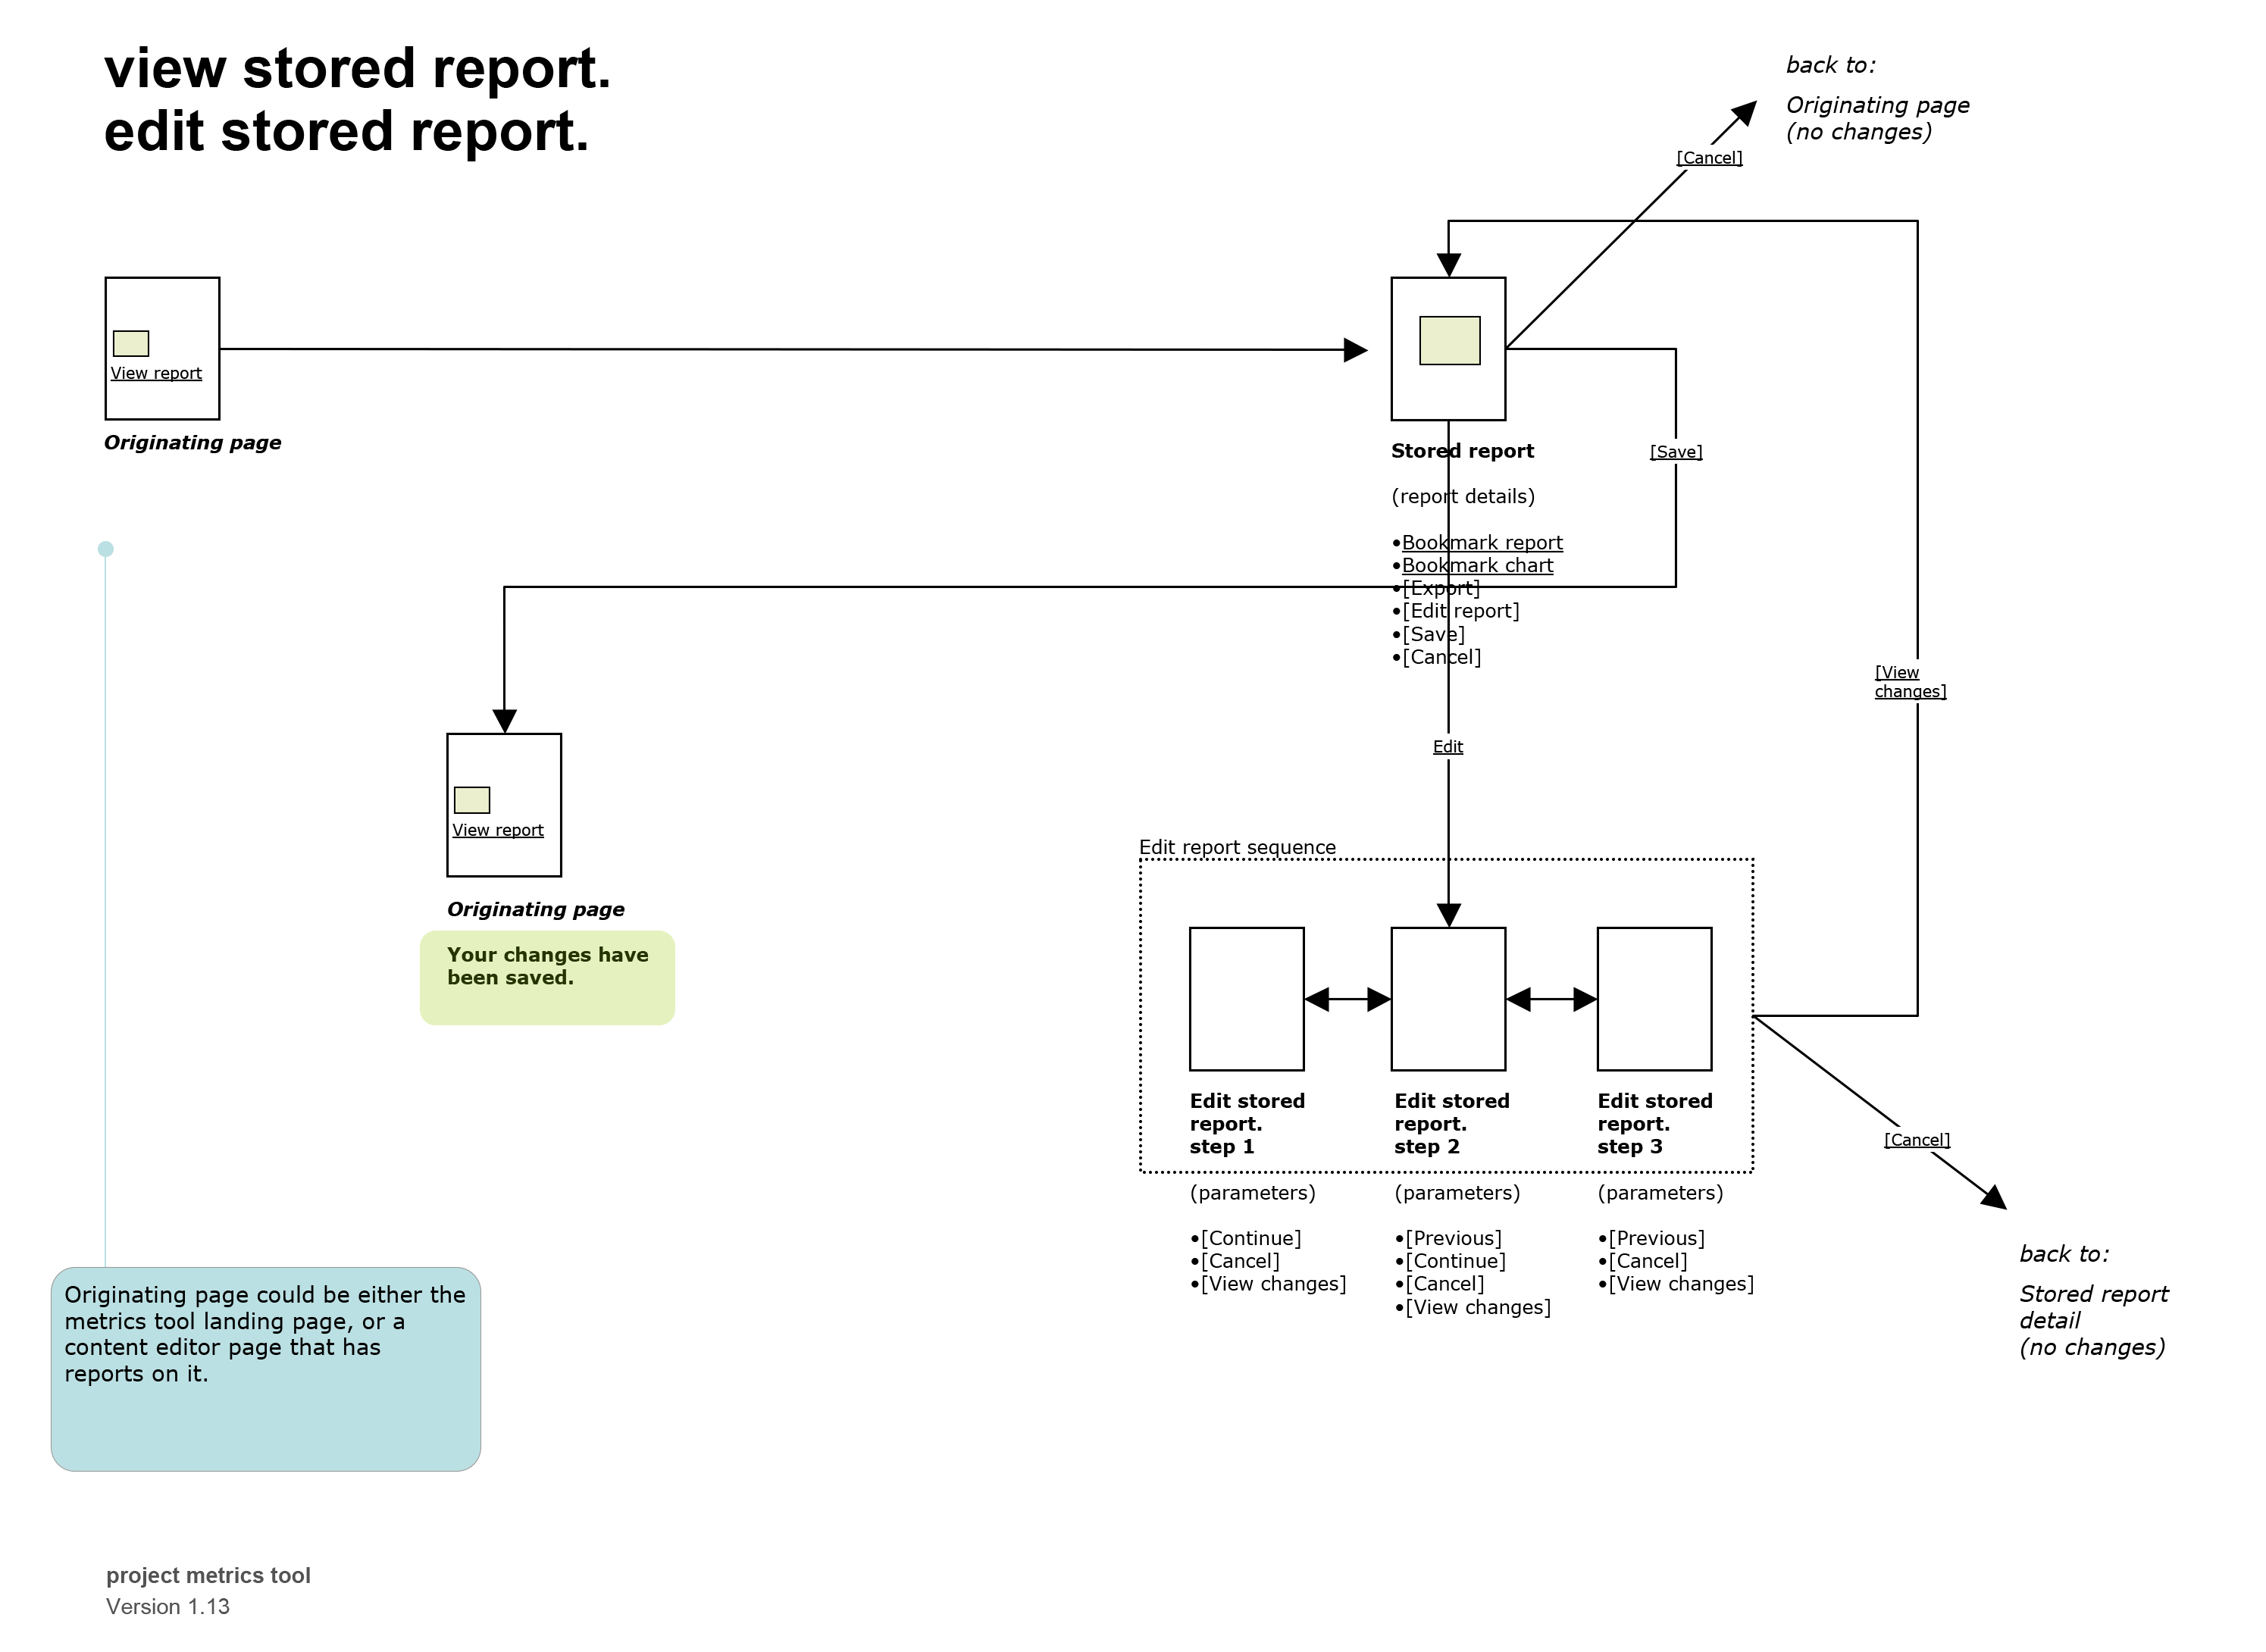
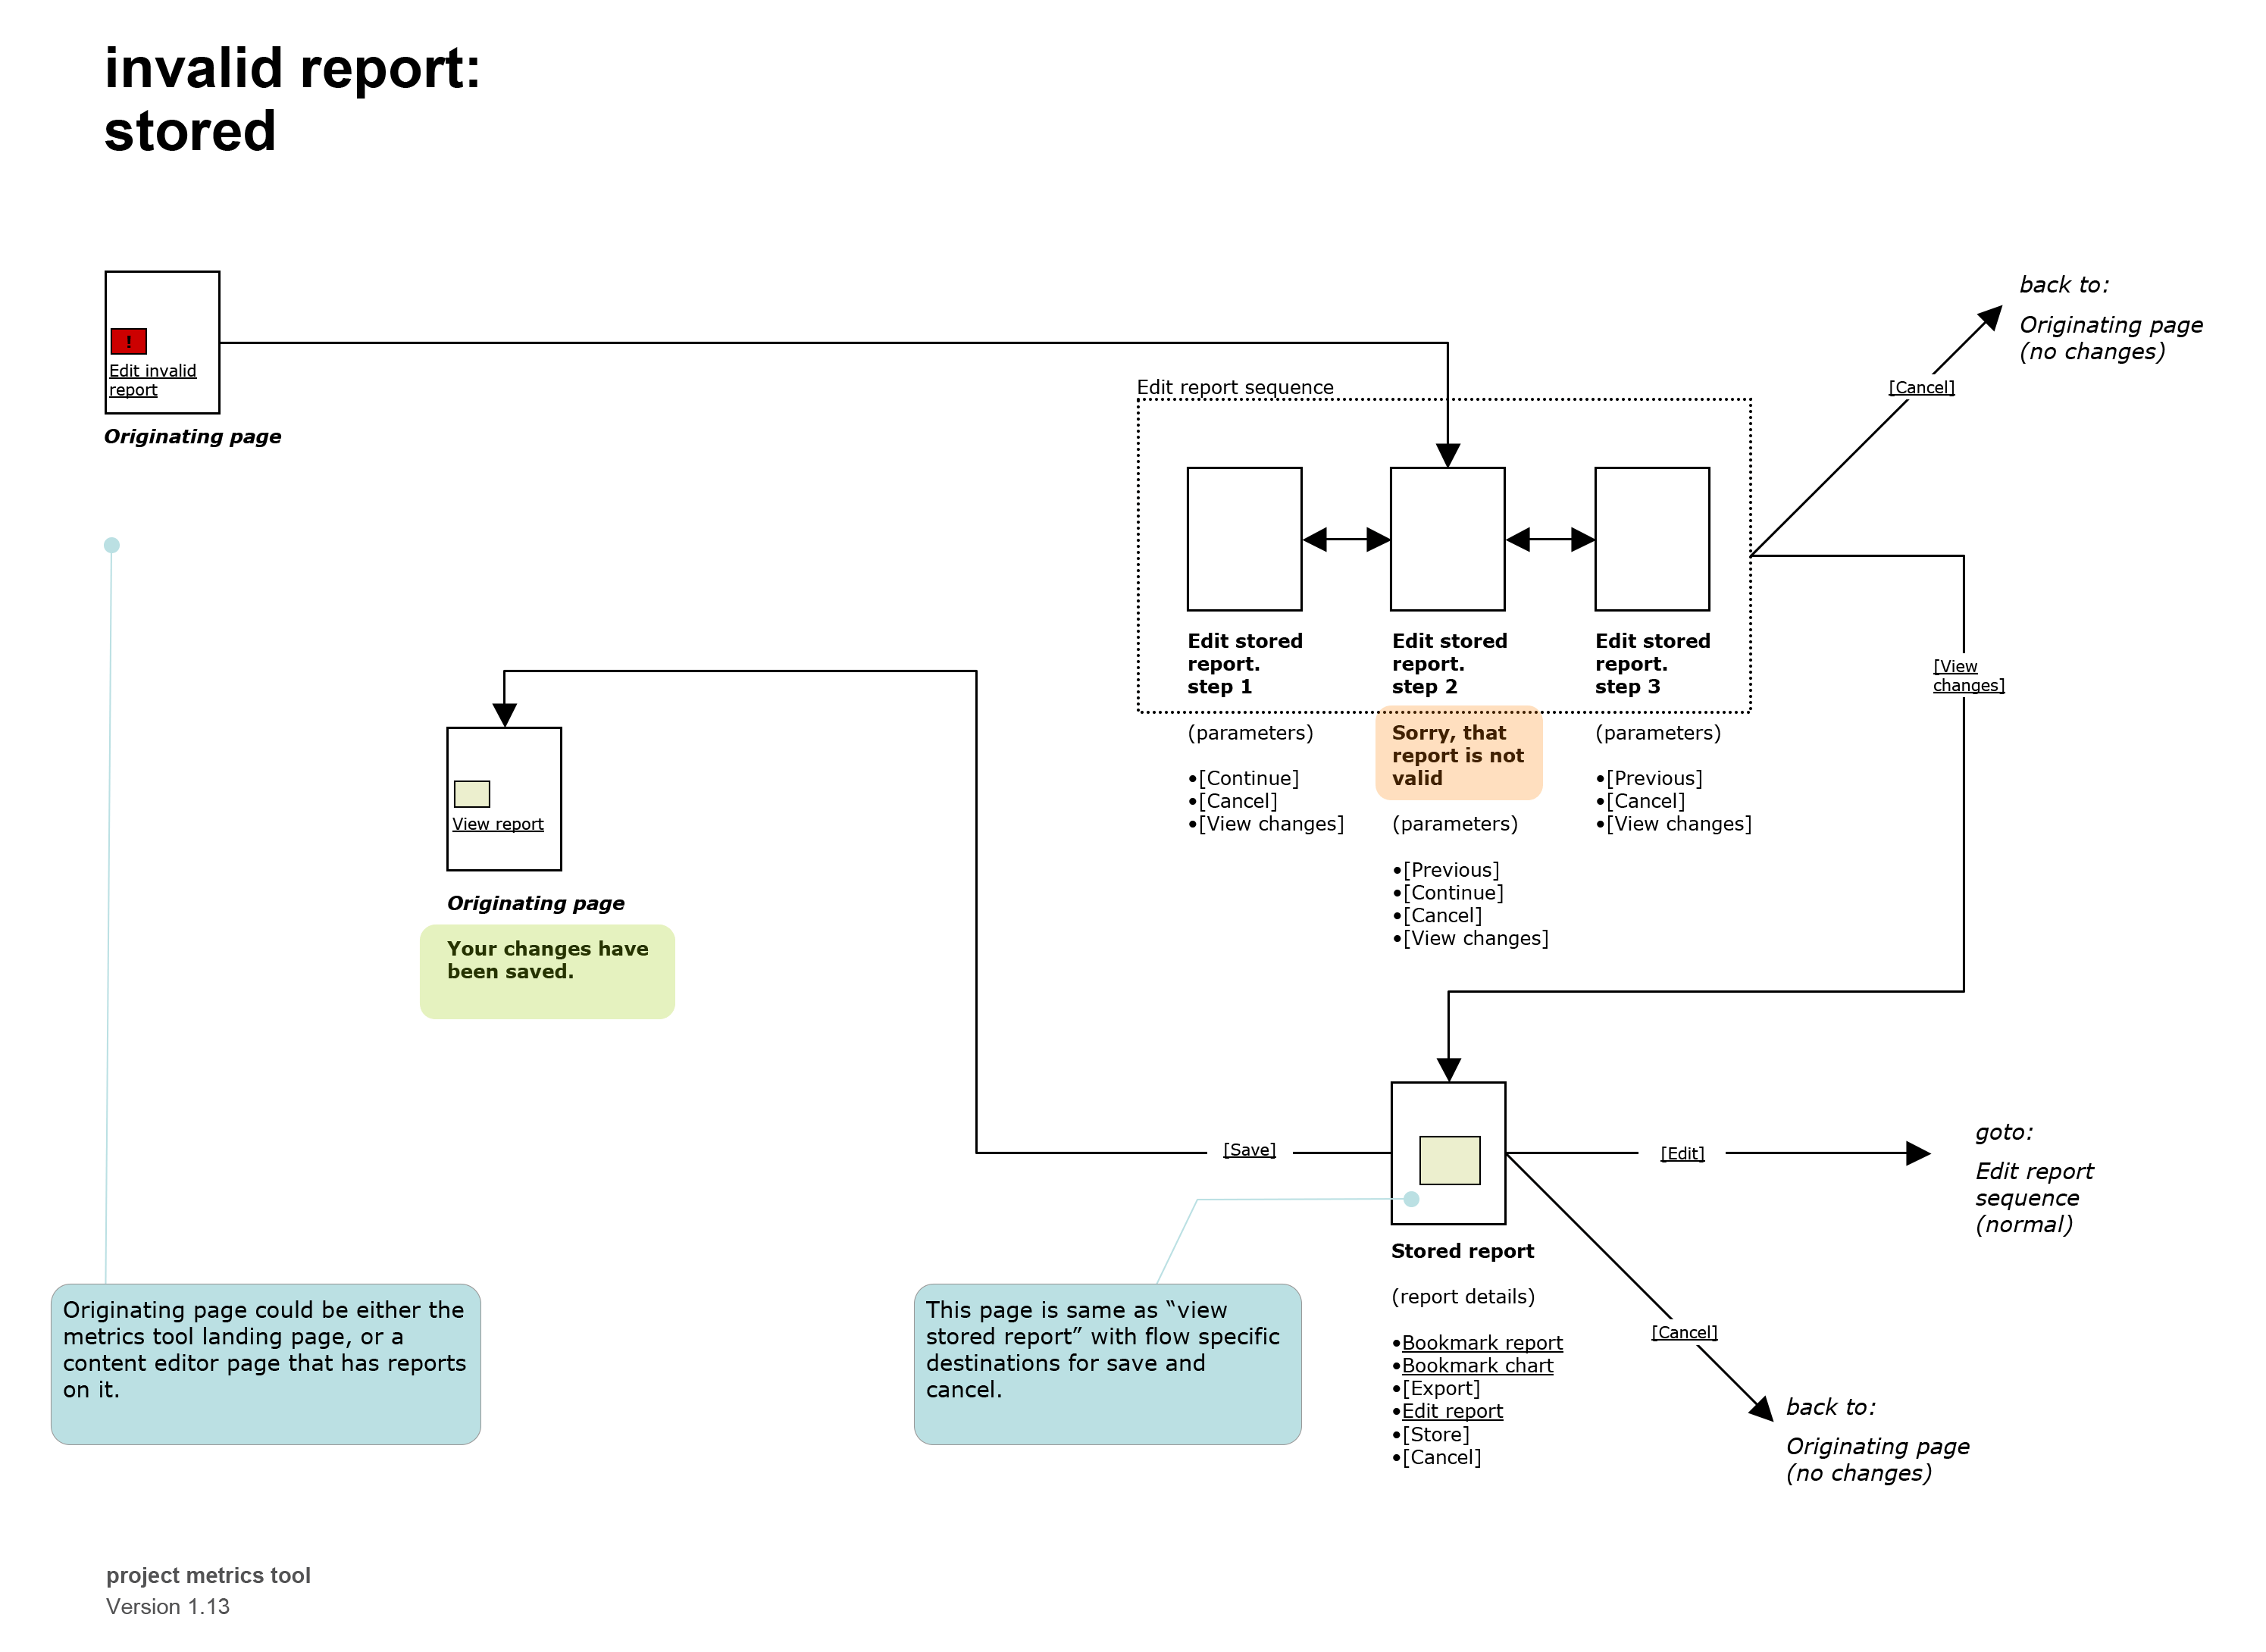
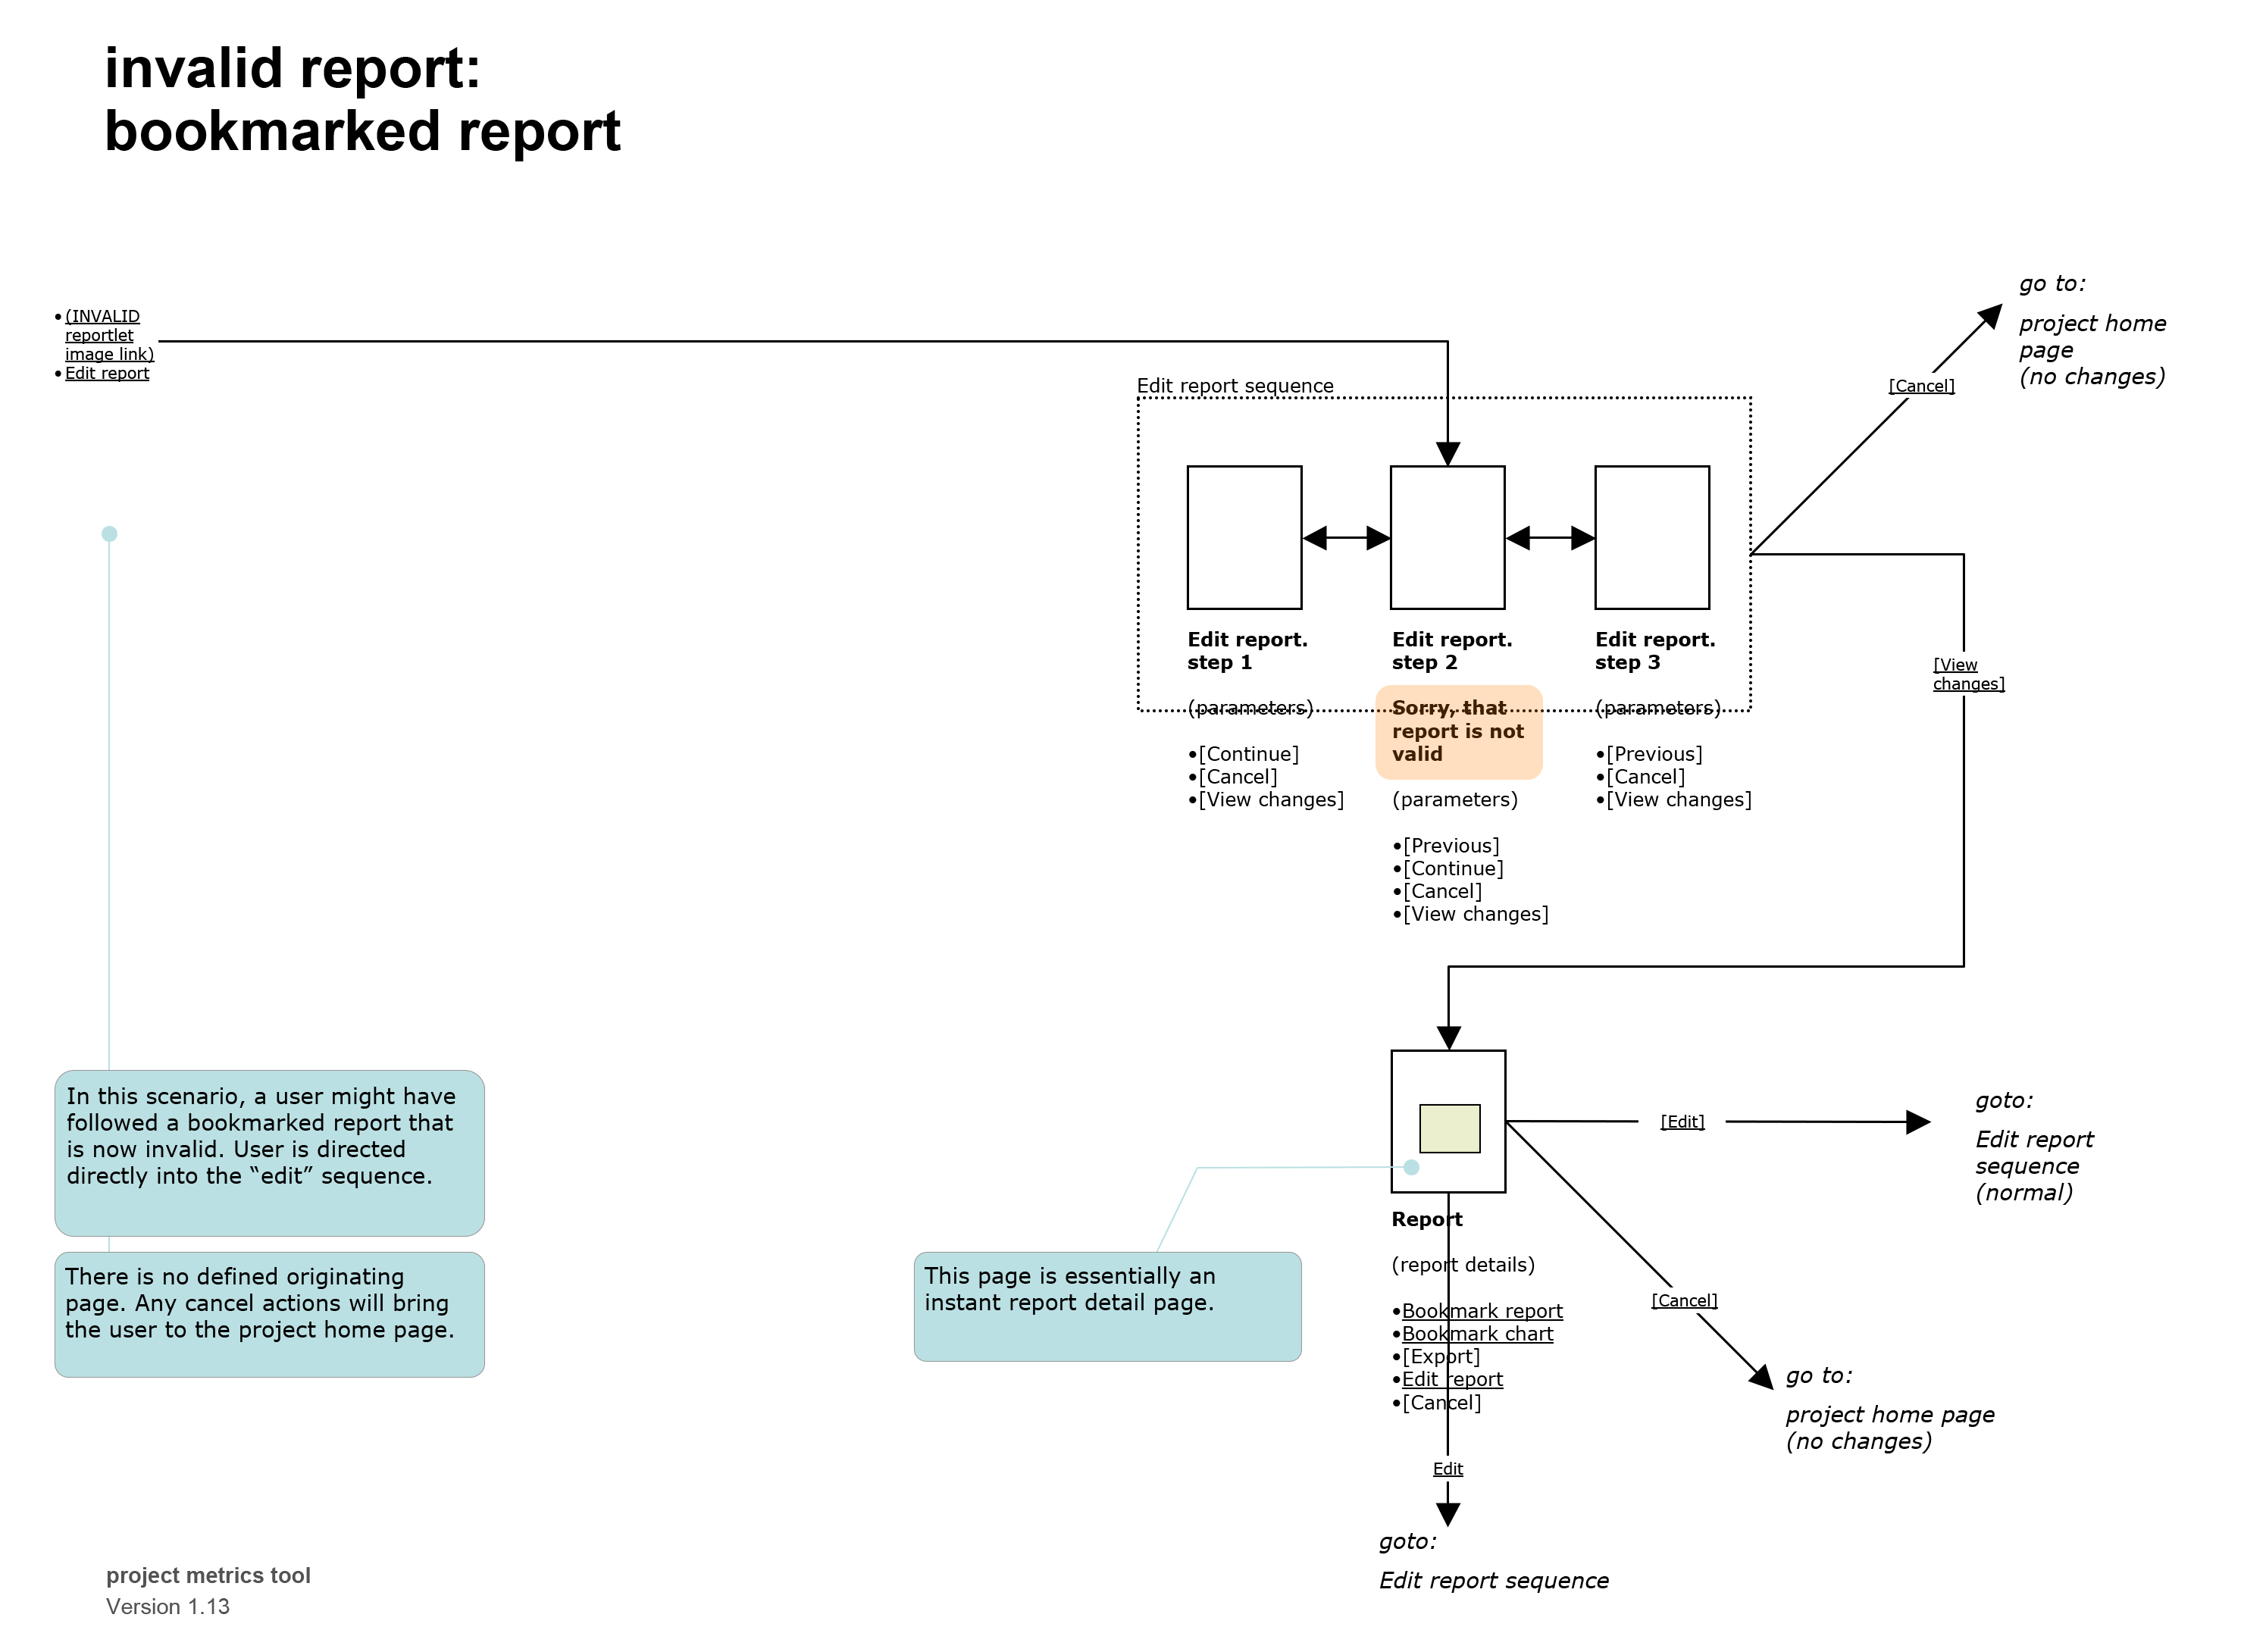
Living Prototypes As Specifications
Working hand-in-hand with the user flow maps, the interactive prototypes tangibly demonstrate the interactions and behaviors of the application.
In this project, the prototypes were the primary design deliverables and were the center of all discussion. Built in HTML, the first prototypes were low fidelity. After a cycle of feedback and review with the entire team, the design was developed further, the fidelity level increased, and the review process repeated.
The First Prototype
Intermediate Stages
- 1
- 2
- 3
Final Design
After five cycles of discussion and review, the design was finalized and the prototype was rebuilt to incorporate the application’s real design language, making it into a living reference specification and a production-ready resource. This provided a shared reference for everyone on the team, improving communications and reducing engineering time.